ENERGY
Our priority is to ensure our power supply at competitive costs, besides using energy efficiently and sustainably.

Our energy strategy is sustained by guidelines on environmental sustainability, safety, cost competitiveness and energy efficiency. Mining and metallurgy is by nature an energy-intensive industry in electricity, natural gas and diesel consumption. For this reason, ensuring a supply sufficient to sustain our operations while using it efficiently to reduce both costs and greenhouse gas (GHG) emissions is imperative to our own competitiveness. This directive has been part of our sustainability strategy since 2010 and has gained new force with the gradual startup of three wind farms and an internal cogeneration plant.

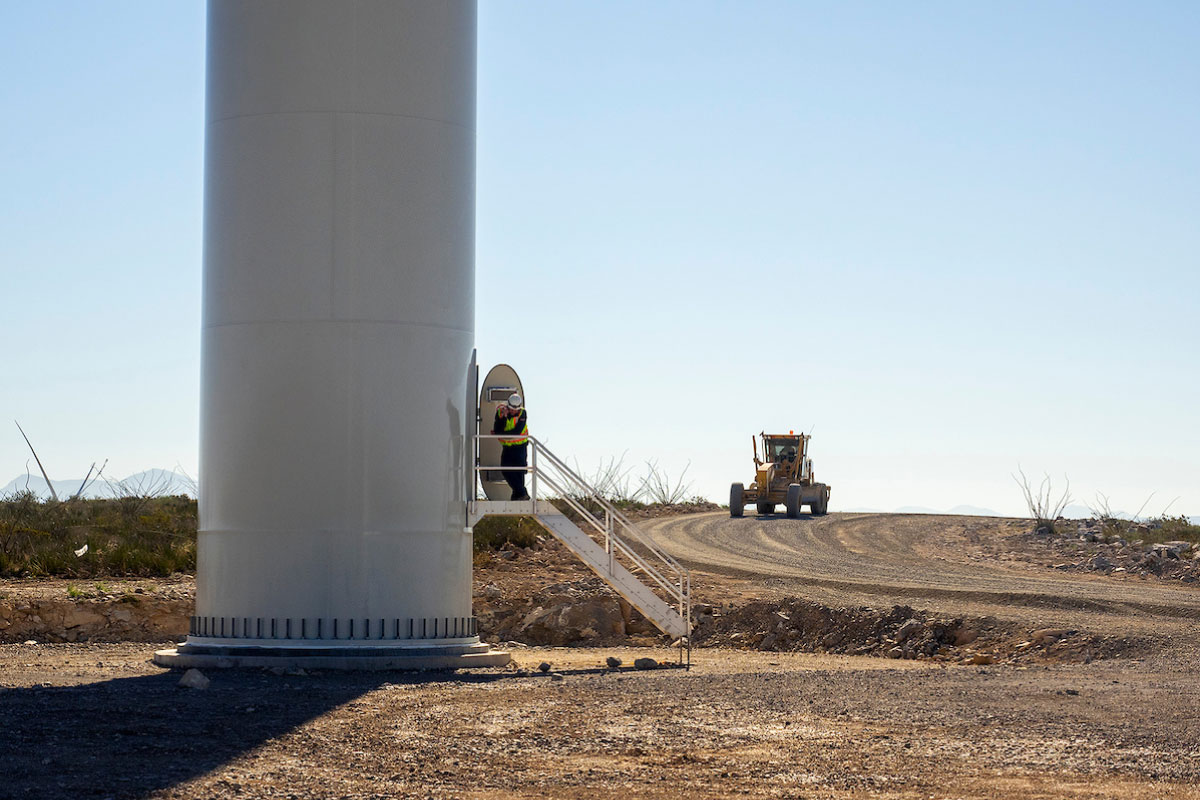
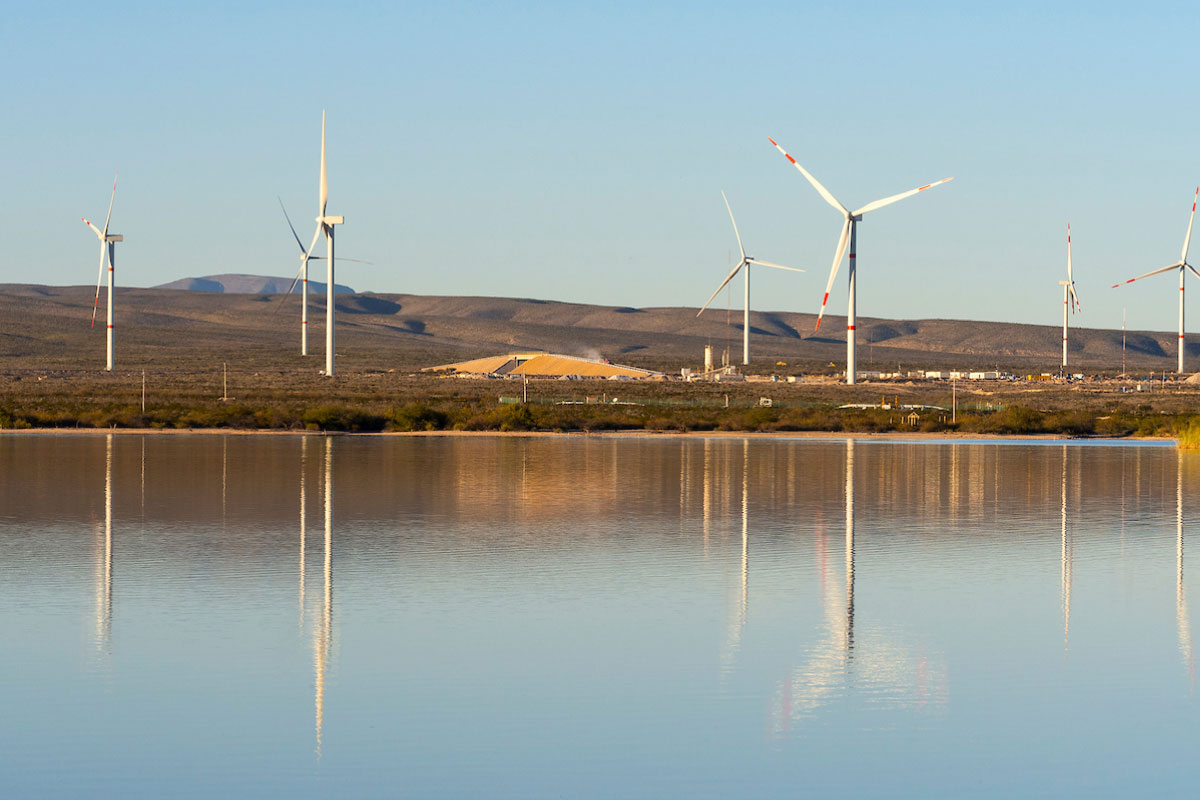
This conviction drives our effort to incorporate an increasing proportion of clean energy into our portfolio. An electricity supply contract with the Mesa La Paz wind farm in the state of Tamaulipas took effect in April. With 306 MW of power capacity, this plant will supply 67% of its total production to cover the expected consumption needs for our company in the medium term—until 2028—and from that year on, will send us 100% of its output until 2045.

Group consumption and clean energy generation
(GWh/yr)

With the progress we have made toward energy self-sufficiency, in 2020 the amount of electricity generated in our plant portfolio was equivalent to 104.7% of our annual consumption. However, total energy delivery was not possible due to a delay in the authorization to allocate the power from Mesa La Paz to our operations. As a result, all of the power generated by this plant was sold on the wholesale electricity market, and we had to acquire the remaining energy from the Federal Electricity Commission (CFE). We expect this gap to be substantially reduced in 2021 and completely eliminated by 2022.

306 MW
generating capacity from Eólica Mesa La Paz, which started operations in April.

The following tables show our energy balance and the sufficiency of our self-supply scheme, offset by the surplus delivered to the National Electricity System and purchases from CFE. Clean energy generation covered 40.6% of our consumption—48.3% starting in April—the equivalent to the electricity consumed by 738,834 homes in Mexico in a year. With this we avoided the emission of 679,491 tCO2e, almost double the figure than the previous year.

POWER GENERATION BY SOURCE
%

Source Description 2020 2019
Termoeléctrica Peñoles (TEP) Located in Tamuín, San Luis Potosí, with installed capacity of 230 MW. It is operated by an independent company, and electricity is supplied under a power purchase agreement expiring in 2027. 57.8 68.0
Eólica de Coahuila (EDC) Located in General Cepeda, Coahuila, with installed capacity of 199.5 MW. The electricity is supplied under a power purchase agreement expiring in 2042. 20.5 23.7
Eólica Mesa La Paz (MLP) Located in Llera de Canales, Tamaulipas, with a capacity of 306 MW; operated by an independent company. Supply is committed under a power purchase contract expiring in 2045. 14.9 -
Fuerza Eólica del Istmo (FEI) Located in El Espinal, Oaxaca, operated by Peñoles; installed capacity of 80 MW. 6.1 6.4
Cogeneration from Met-mex Turbo-generator with 7 MW unit capacity that utilizes steam from the roasting area of the zinc plant. 0.7 1.9
Supply from proprietary sources in 2020 (3,466 GWh/year) 100.0 100.0
Energy generation in relation to consumption in 2020 (3,311 GWh/year) 104.7 90.1

Of the power generated by Grupo Peñoles' sources, 83.4% was assigned to Peñoles’ operations and 2.9% to other companies of Grupo BAL. The share for each source in Grupo Peñoles' consumption (without BAL) is shown in the following table:

POWER CONSUMPTION BY SOURCE
%

Source 2020 2019
TEP 58.4 61.0
EDC 21.6 22.3
FEI 2.7 3.2
Cogeneration 0.7 1.7
Total supply from proprietary sources in 2020 (2,762 GWh/year) 83.4 88.2
Energy purchased from CFE in 2020 (549 GWh/year) 16.6 11.8
Total consumption in 2020 (3,311 GWh/year) 100.0 100.0
Energy from MLP sold on the wholesale electricity market 15.6 -
Energy available from own sources 99.1 88.2
40.6%
of our power consumption was supplied by clean sources.

In 2020, Peñoles’ total electricity consumption was 3,311 GWh (equivalent to an annual average demand of 378.0 MW), 2.7% lower than the previous year, due to the public health emergency and suspension of activities at three of our mining units. Additionally, the Peñoles’ energy division supplied 99.8 GWh to companies of Grupo BAL, for a total consumption of 3,411 GWh.

The average unit cost of the electricity consumed was US¢ 6.86/kWh, 6.7% higher than the previous year. This increase was due primarily to the sharp rise in transmission rates charged by CFE to legacy self-supply centrals—500% for renewables and 90% for thermoelectric plants—the constitutionality of which is under debate. There was also an increase in our consumption of energy purchased from the CFE, with a unit cost 14% higher than the energy supplied by our own plants.

Fuel Unit Total 2020 Total 2019 % chge.
Liquefied natural gas MI 5.4 4.6 18.7
Natural gas Mm3 183 192 -4.9
Diesel MI 181 209 -13.2

New regulations for the power sector that took effect in 2018 require major users and suppliers of electricity to acquire Clean Energy Certificates (CELs). To cover the obligations accrued in 2019, we acquired 107,364 CELs in 2020, 16,000 of which were purchased from other companies and the rest were supplied by generation from the Mesa La Paz wind farm.

As we discussed in last year’s Annual Report, in 2016 the Energy Regulation Commission issued a new technical regulation called the Network Code, intended to guarantee the stability, reliability and security of the National Electricity System. Peñoles made the necessary adjustments to its electric installations to comply with the Code, particularly as regards energy quality indicators like power factor and harmonic current control. Furthermore, all of our high-voltage facilities completed their projects, in compliance with the technical and legal requirements of the Code.

In 2020, Fuentes de Energía Peñoles (FEPSA) began operating as a supplier of qualified services in the wholesale electricity market. FEPSA signed a power supply contract with the Mesa La Paz wind farm, and also represents the group’s consumers before the National Energy Control Center (CENACE).

Although 2020 presented significant challenges to our progress toward energy self-supply from renewable sources, we remain firm in our goal of increasing the share of clean technologies within the company’s energy portfolio. The execution will depend upon the national energy policy. In the meantime, we will continue to explore potential wind and solar farm projects.

With regard to our use of other fuels, we reduced our consumption of diesel by 13.2% during the year, and our natural gas consumption by 4.9%. Only the use of liquefied natural gas was increased to replace the use of diesel in heavy duty truckloads in open-pit mines to reduce greenhouse gas emissions. This project, together with the monitoring of emerging technologies such as the electrification of our mobile equipment, storage in batteries and production of hydrogen, opens possibilities for the long-awaited goal of being CO2 emissions neutral.

POWER CONSUMPTION BY TECHNOLOGY
%


* In 2020, the percentage indicates the generation of clean energy vs consumption, of which 15.6% corresponds to MLP that was sold on the wholesale electricity market.

CONTENTS

2020 brought us great challenges and lessons. Our Annual Report highlights the strengths that have allowed us to overcome difficulties while generating value to our stakeholders.

The following abbreviations will be used throughout the report:

oz =
lb =
Mm3 =
Ml =
Mlb =
Mlbe =
Moz =
koz =
t =
Mt =
kt =
MI =
US$B =
US$M =
US$/t =
US$/oz =
US¢/lb =
US¢/lbe =
ounces
pounds
million cubic meters
million liters
million pounds
million pounds equivalent
million ounces
thousand ounces
metric tons
million metric tons
thousand metric tons
million liters
billion dollars
million dollars
dollars per metric ton
dollars per ounce
dollar cents per pound
dollar cents per pound equivalent

PROFILE
We are a proud Mexican company, committed to our country, with presence in the international market.

FINANCIAL HIGHLIGHTS
In a complex environment, we focused on preserving liquidity, while continuing our priority investments.

MANAGEMENT REPORTS
We manage our business responsibly and prudently, with a long-term vision.

PERFORMANCE
Our operations faced great challenges during the year. We improved our processes and sought cost reduction.

ENERGY AND TECHNOLOGY
We incorporated new technologies to increase productivity and efficiency.

CORPORATE GOVERNANCE
Our corporate governance ensures transparency, the compliance with organizational values and accountability.

INFORMATION FOR SHAREHOLDERS
Contacts available for our shareholders

FINANCIAL STATEMENTS
We present our audited financial information in thousand US dollars.


DISCLAIMER
This Annual Report contains certain forward-looking information relating to Industrias Peñoles, S.A.B. de C.V. and its subsidiaries (Peñoles or the Company) that is based on assumptions made by its management. Such information, as well as the statements with respect to future events and expectations are subject to certain risks, uncertainties and factors that could cause the actual results, performance or achievements of the Company to be materially different at any time. Such factors include changes in general economic, governmental policy and/or business conditions nationally and globally, as well as changes in interest rates, inflation rates, exchange rates, mining performance in general, metal demand and quotations, and raw material and fuel prices, among others. Due to these risks and factors, actual results may vary materially from the estimates described herein, for which reason Peñoles does not assume any obligation with respect to such variations or to information provided by official sources.