TOTAL SALES*
* Includes hedging results.
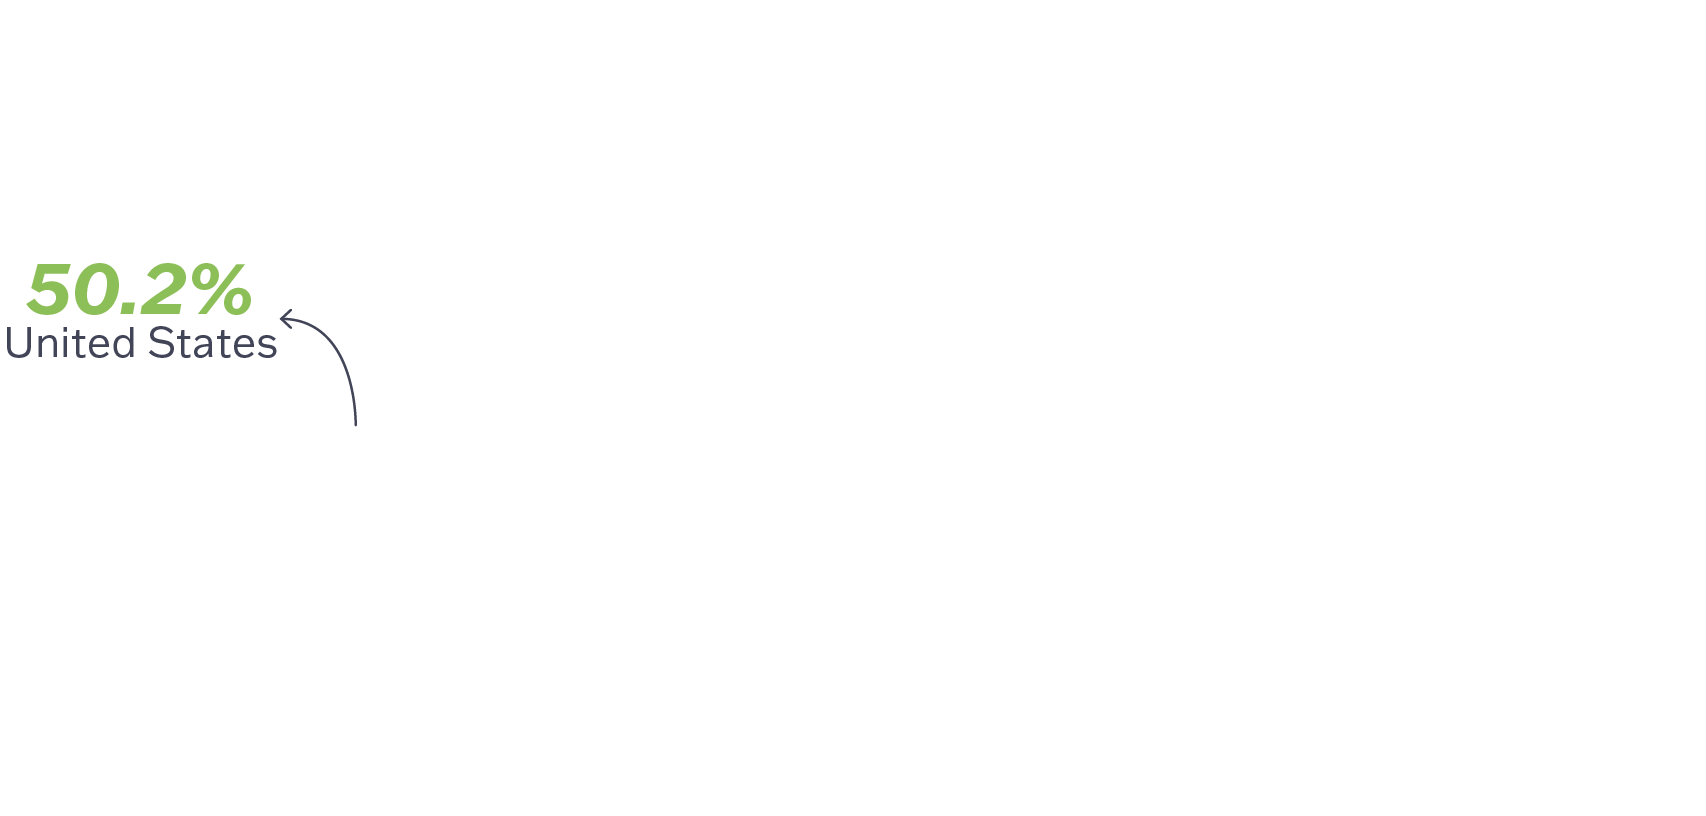
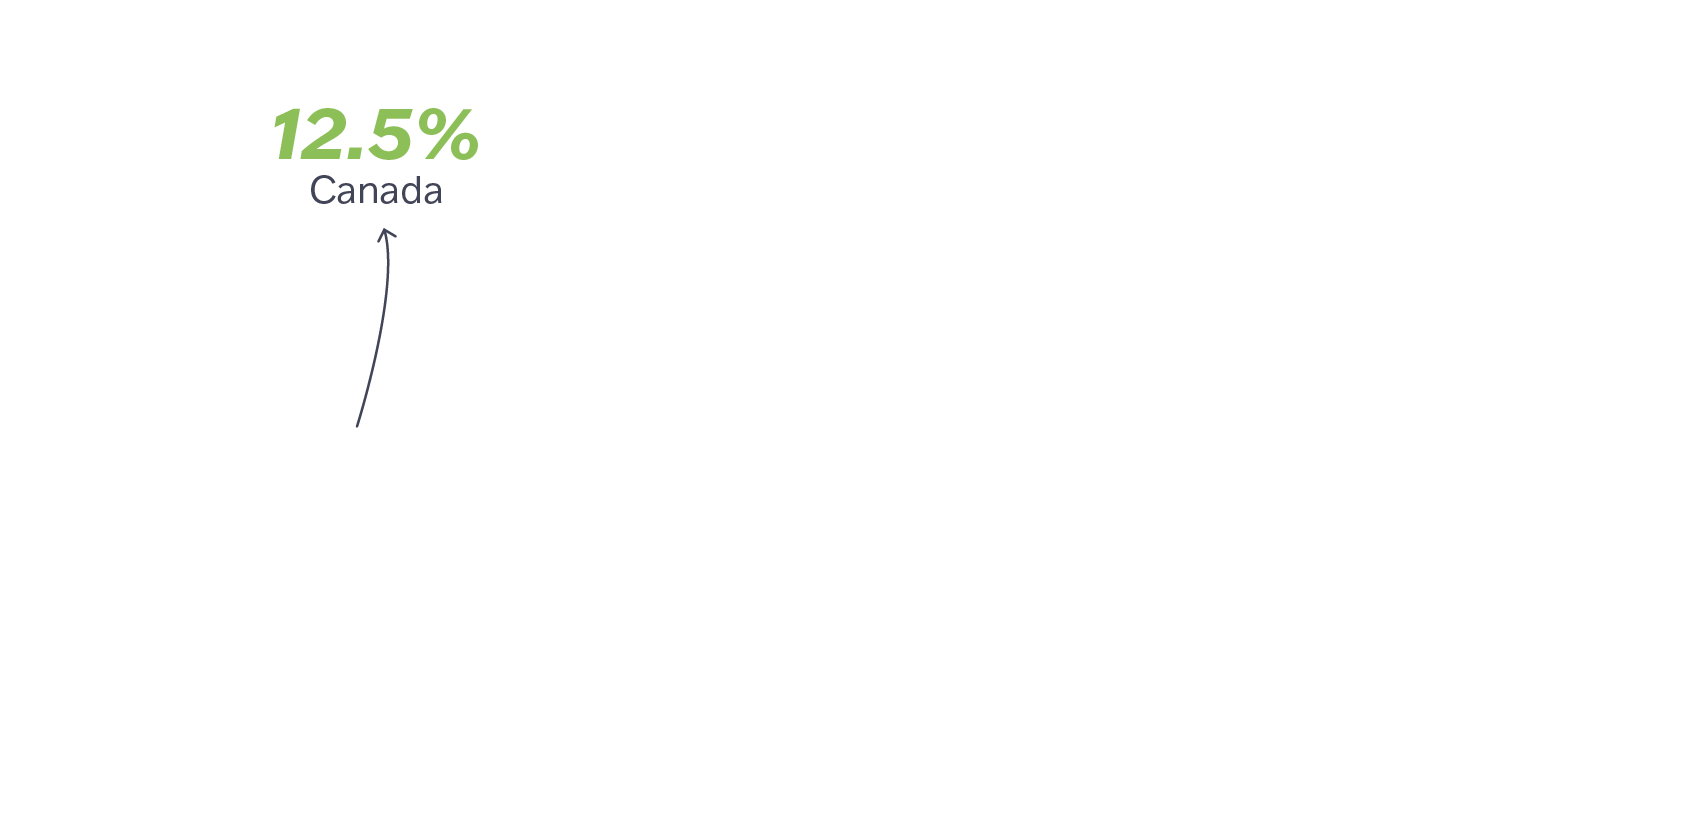
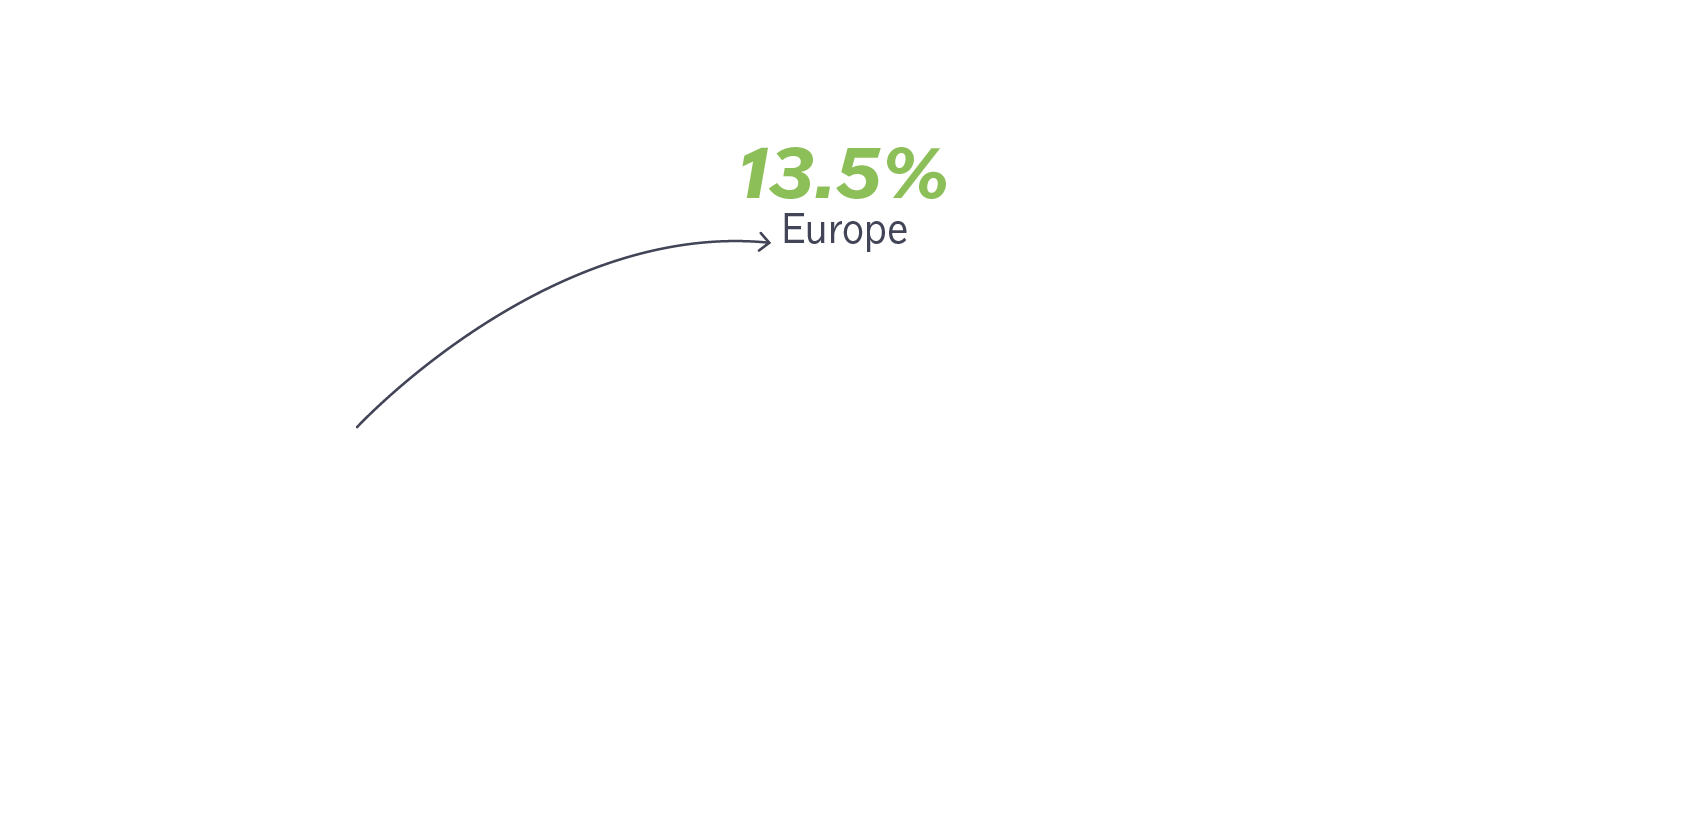
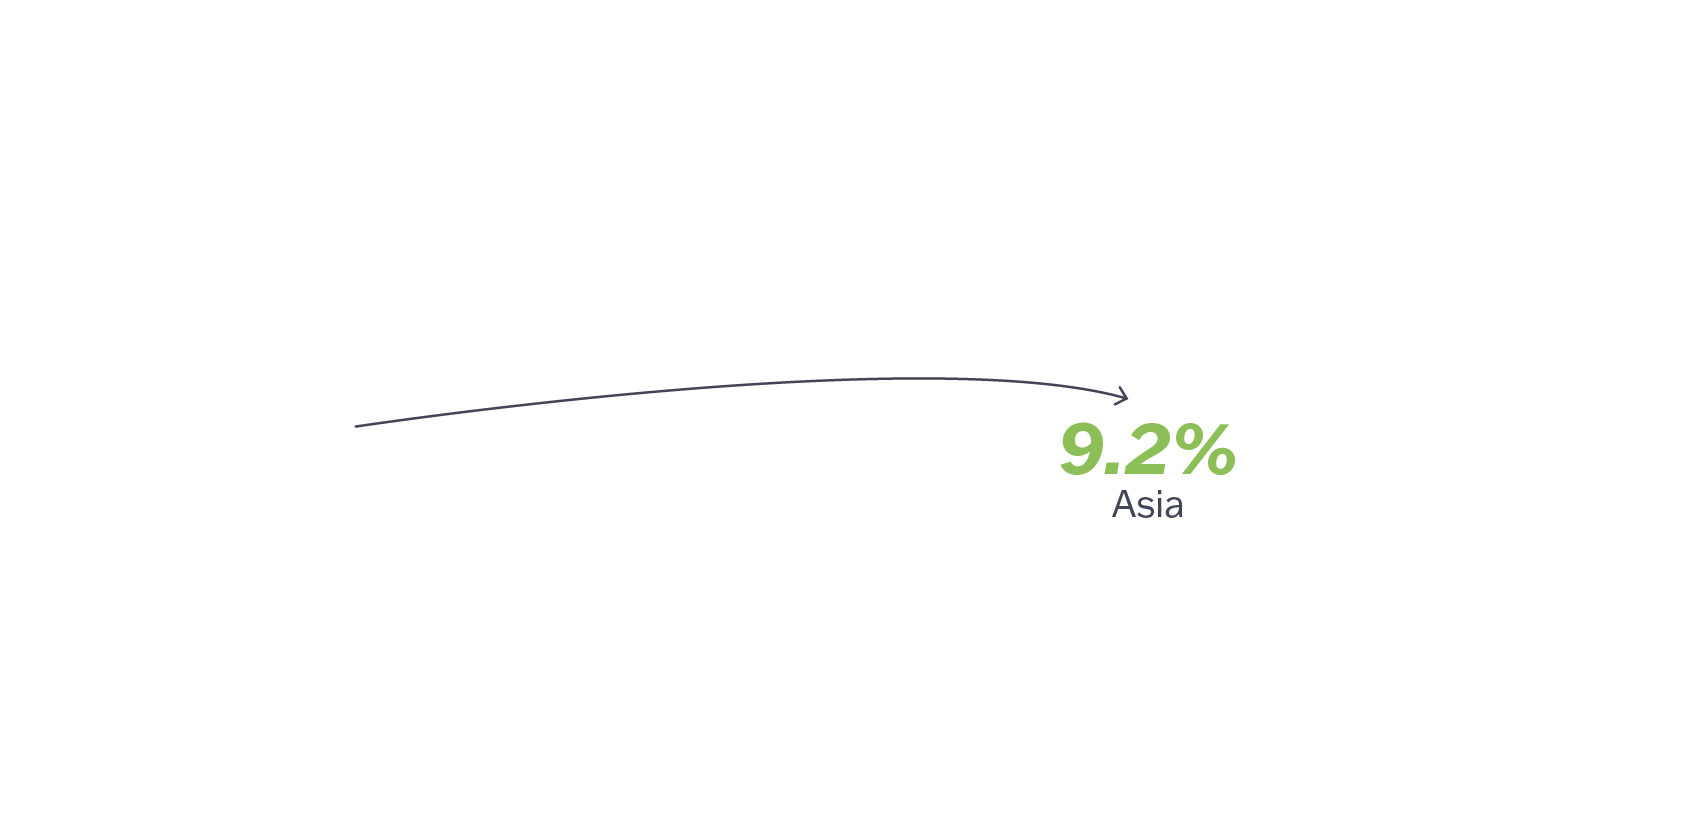
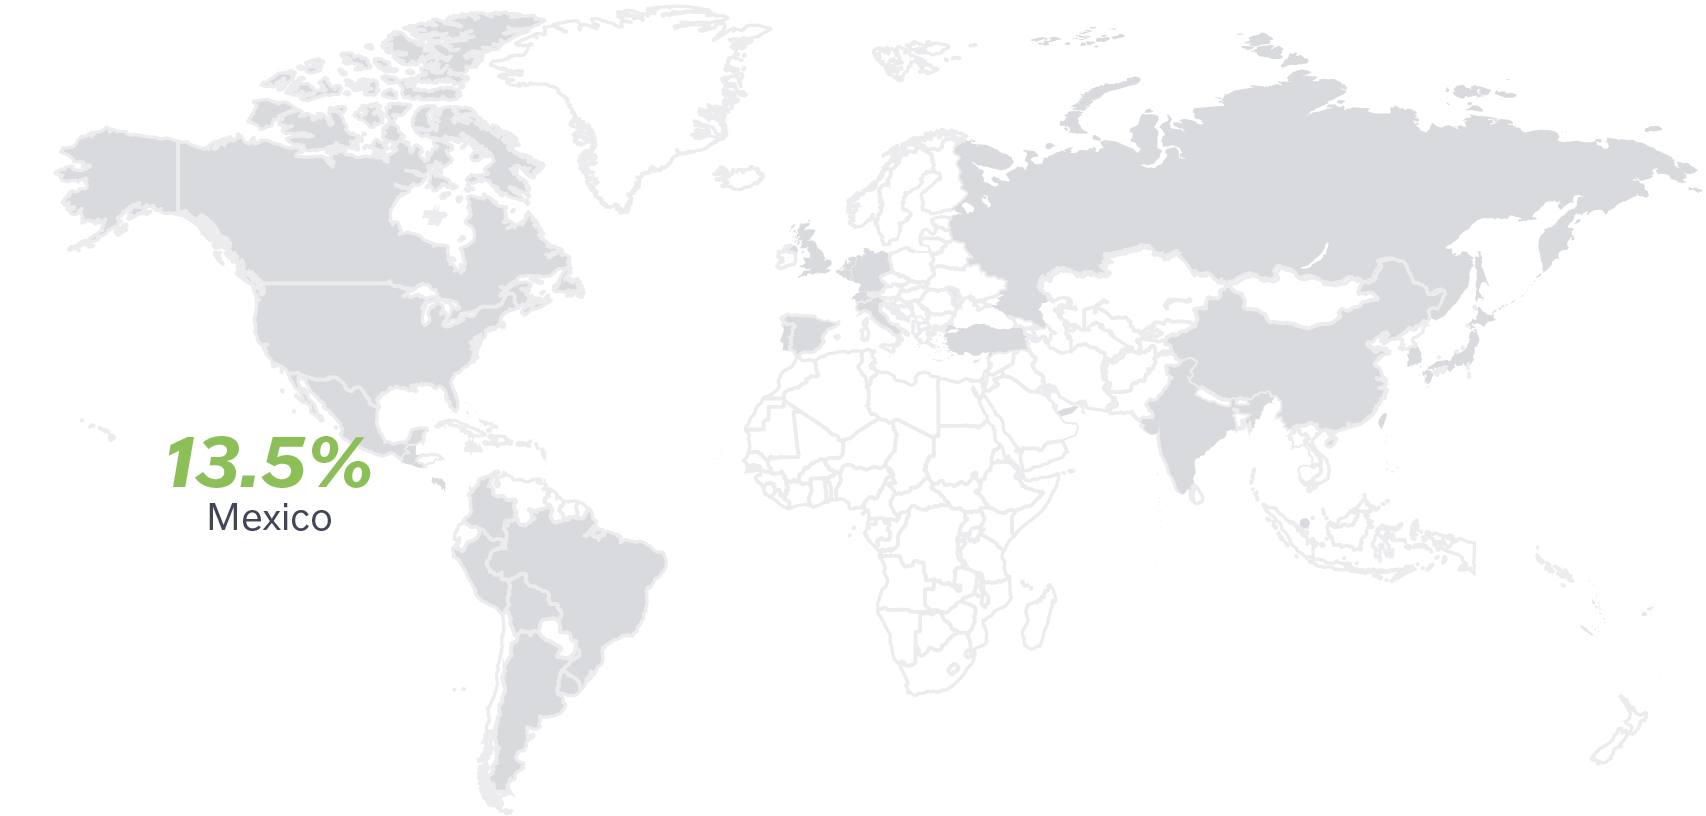
Besides Mexico, we participate in other 29 markets in the Americas, Europe and Asia.
US$ 1.62 B
in gold sales
in gold sales
US$ 1.43 B
in silver sales
in silver sales
US$ 622 B
in zinc sales
in zinc sales
US$ 347 B
in concentrates sales
in concentrates sales
US$ 4.67 B
in total sales.
in total sales.
| Gold | 34.7% |
|---|---|
| United States | 39.5% |
| Canada | 36.4% |
| England | 23.8% |
| Silver | 30.5% |
|---|---|
| United States | 90.7% |
| Japan | 7.4% |
| Brazil | 1.4% |
| Zinc | 13.3% |
|---|---|
| United States | 48.0% |
| Mexico | 29.8% |
| Switzerland | 11.3% |
| Concentrates | 7.4% |
|---|---|
| Singapore | 71.5% |
| Japan | 13.5% |
| Switzerland | 9.7% |
| Lead | 5.4% |
|---|---|
| Mexico | 59.5% |
| Switzerland | 25.8% |
| United States | 12.3% |
| Sodium sulfate | 2.2% |
|---|---|
| Mexico | 89.2% |
| Colombia | 7.0% |
| Brazil | 2.6% |
| Copper | 1.8% |
|---|---|
| United States | 76.8% |
| Switzerland | 22.9% |
| Mexico | 0.3% |
| Other products | 4.7% |
|---|---|
| Mexico | 57.7% |
| South Korea | 10.1% |
| Belgium | 8.6% |
MINING DIVISION SALES*
%

| US$ M | ||
|---|---|---|
| Gold | 1,051 | |
| Silver | 1,553 | |
| Zinc | 554 | |
| Copper | 129 | |
| Lead | 143 | |
| Total | 3,430 |
*Does not include hedging results, treatment charges nor penalties.
METALS DIVISION SALES**
%

| US$ M | ||
|---|---|---|
| Gold | 1,652 | |
| Silver | 1,438 | |
| Zinc | 587 | |
| Lead | 247 | |
| Others | 185 | |
| Total | 4,109 |
** Does not include Bal Holdings.
CHEMICALS DIVISION SALES
%

| US$ M | ||
|---|---|---|
| Sodium sulfate | 104 | |
| Magnesium oxide | 45 | |
| Ammonium sulfate | 36 | |
| Magnesium sulfate | 11 | |
| Others | 4 | |
| Total | 199 |
PRODUCTION COSTS
%

| US$ M | ||
|---|---|---|
| Depreciation and amortization | 698 | |
| Contractors | 416 | |
| Energy | 374 | |
| Operating materials | 346 | |
| Maintenance and repairs | 311 | |
| Human capital | 286 | |
| Other | 89 | |
| Total | 2,519 |