ENERGY AND GHG EMISSIONS
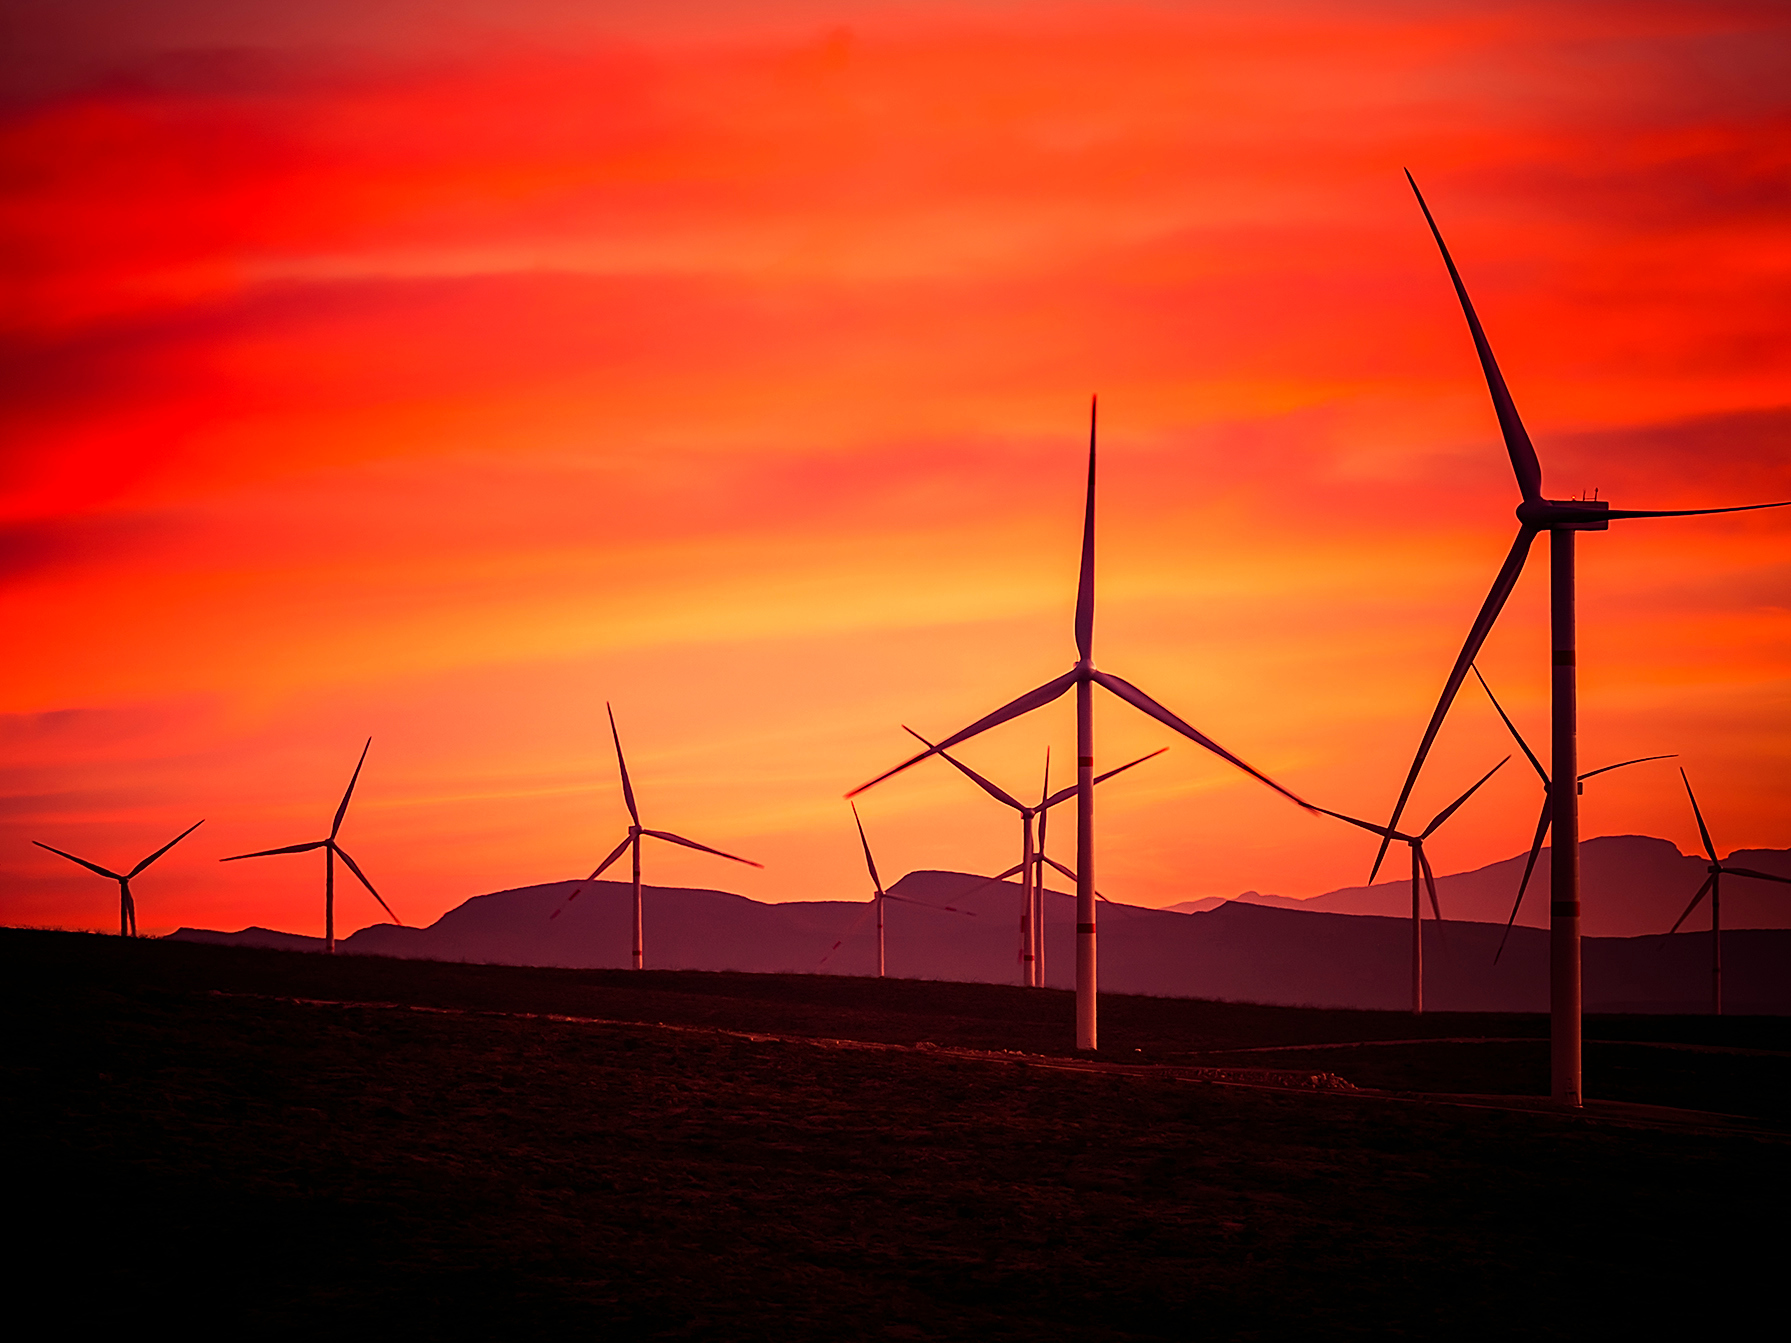
Wind energy from Eólica de Coahuila
ENERGY AND GHG EMISSIONS
The consumption of fuel and electricity for our operations makes up a substantial portion of our production costs, so using energy efficiently is in our best interests. It should be borne in mind, however, that the energy intensity of mining operations necessarily depends on the stage at which the project is operating, and it grows as ore grades diminish and ore deposits grow deeper, which generally occurs as mining progresses.
The burning of fuels on site contributes to direct (scope 1) GHG emissions by the industry, and the purchase of electricity from the national network can generate indirect (scope 2) emissions.
Although we consume energy from fossil fuels—indispensable due to the technology we use, which is one of the best available at present—most comes from natural gas (78.4%), the least polluting hydrocarbon; we also use metallurgical coke (12.1%) to obtain lead, and diesel (8.9%) for machinery and transportation of the ore to the plants for processing.
302-1, 302-2, EM-MM-130a.1-1
In 2020, total consumption of electrical energy and fuel was 16.69 million gigajoules (GJ).
In our consumption of electrical energy, we are increasing the proportion of renewable sources and self-supply in our mix. In 2020, the new Mesa La Paz wind farm started operations in Tamaulipas. Adding in the power generated by this plant combined with two other wind farms—Fuerza Eólica del Istmo, in Oaxaca and Eólica de Coahuila—40% of the electrical energy generated for self-supply comes from renewable sources. For reasons having to do with official procedures with the Energy Regulatory Commission (CRE) for commercial effects, not all of this energy was assigned by the CFE to Industrias Peñoles, and some was sold on the wholesale electrical market, while Peñoles had to acquire the remaining energy commercially from the CFE to cover our needs.
This 40% reflects the group’s efforts and contractual commitments to operate in an increasingly sustainable manner. Our target for 2028 is to obtain 100% of our electrical energy from clean sources.
Annual energy consumption by Peñoles alone totaled 2,241.73 GWh, 14% of which (309.87 GWh) came from renewable sources; this is equivalent to avoiding the emission of 153,074 metric tons of CO2e into the atmosphere* and the emissions of 139,000 people consuming electrical energy in Mexico.**
Emission factor from the National Electrical System 2020 0.494 tCO2e /MWh
**Average electrical energy consumption per inhabitant 2228.1 kWh in 2018, data from the Ministry of Energy.
14%
of our annual energy consumption came from renewable sources.
2019 |
% |
2020 |
% |
|
|---|---|---|---|---|
| Scope 2 (Consumption of electrical energy) | ||||
| Electricity (Conventional sources) | 7,251,656 | 85 | 6,954,700 | 86 |
| Electricity (Clean sources) | 1,238,048 | 15 | 1,115,516 | 14 |
| Total | 8,489,704 | 100 | 8,070,216 | 100 |
| Scope 1 (From the organization) | ||||
| Natural gas | 7,093,363 | 73.8 | 6,754,221 | 78.4 |
| Metallurgical coke | 1,107,274 | 11.5 | 1,040,090 | 12.1 |
| Diesel | 1,096,988 | 11.4 | 770,149 | 8.9 |
| Fuel oil | 206,116 | 2.1 | 0 | 0.0 |
| Other fuels | 113,452 | 1.2 | 55,398 | 0.6 |
| Total | 9,617,191 | 100 | 8,619,858 | 100 |
SUBSTITUTION OF ELECTRICAL ENERGY FROM RENEWABLE SOURCES
(%)
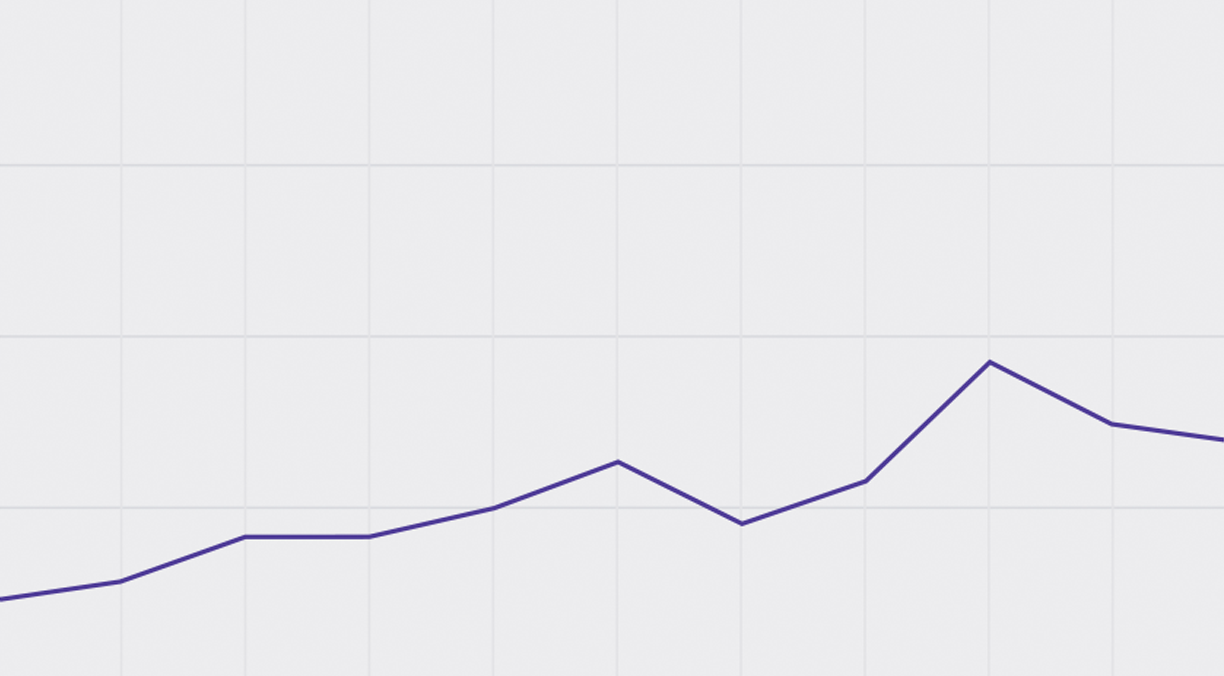
40
30
20
10
0
2010
2011
2012
2013
2014
2015
2016
2017
2018
2019
2020
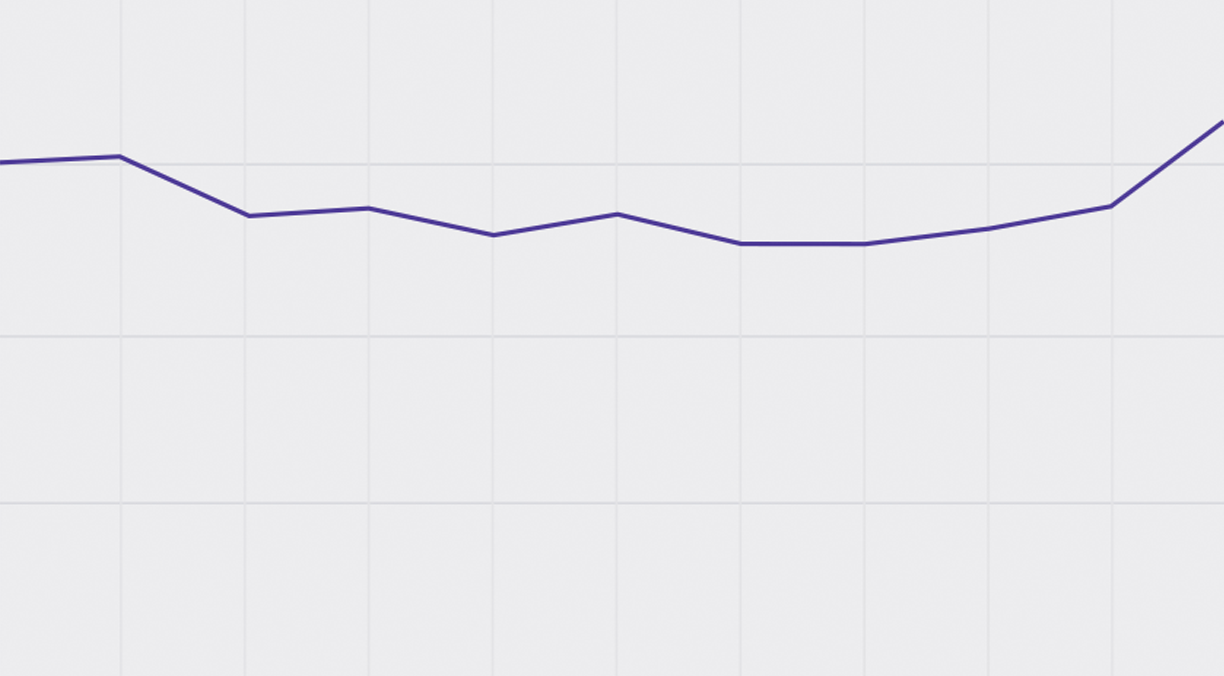
CONSUMPTION OF ENERGY AND ELECTRICITY
(GJ/T Production)
2.0
1.5
1.0
0.5
0
2010
2011
2012
2013
2014
2015
2016
2017
2018
2019
2020
| 2010 | 2011 | 2012 | 2013 | 2014 | 2015 | 2016 | 2017 | 2018 | 2019 | 2020 | |
|---|---|---|---|---|---|---|---|---|---|---|---|
| Conventional | 6,633,720 |
6,820,049 |
6,606,598 |
6,748,972 |
6,886,327 |
6,362,477 |
6,420,794 |
6,259,466 |
5,847,918 |
7,251,656 |
6,953,438 |
| Clean | 241,123 |
335,206 |
593,630 |
581,446 |
743,448 |
895,903 |
640,658 |
740,754 |
1,252,518 |
1,238,048 |
1,115,516 |
| Total general | 6,874,843 |
7,155,255 |
7,200,228 |
7,330,418 |
7,629,775 |
7,258,380 |
7,061,452 |
7,000,220 |
7,100,436 |
8,489,704 |
8,068,954 |
| 2010 | 2011 | 2012 | 2013 | 2014 | 2015 | 2016 | 2017 | 2018 | 2019 | 2020 | |
|---|---|---|---|---|---|---|---|---|---|---|---|
| Consumption of energy and electricity (GJ) / t production |
1.50 |
1.52 |
1.35 |
1.36 |
1.29 |
1.35 |
1.27 |
1.27 |
1.30 |
1.36 |
1.62 |
Data includes information only from Peñoles operations.
These determinations are based on the energy balances reported by CFE, derived from transmission agreements and contracts, as well as the utility bills paid at standard CFE rates. They are verified internally by metering systems which transmit data to the Shared Energy Services Center, the area of CFE in charge of this procedure. To calculate gigajoules from fuel consumption we used the calorific power provided by the supplier.
302-3, 302-4, 302-5
Overall, our eco-efficiency index rose last year from 1.36 to 1.62GJ/t, due primarily to the combined effect of more energy consumption in the zinc plant, the suspension of operations at Madero and Milpillas, and the startup and stabilization of the new Capela mine.
The above calculation factors in the sum of the fuel and electric power for the main products of our Metals and Chemicals Divisions and the metric tons milled at our mines; at Milpillas, it is based on the volume of metric tons deposited at the leaching pad.
Daybreak at Química del Rey
1.62GJ/t
eco-efficiency index during the year
GHG emissions
103-1, 103-2, 103-3, 305-1, EM-MM-110a.2.-5
Regulatory efforts to reduce GHG emissions in order to combat the risks posed by climate change may result in additional compliance costs and risks for companies relating to climate change mitigation policies. There is also the cost of reducing and adapting to this risk.
Our GHG emissions reduction strategy involves primarily the use of natural gas and self-supply of electrical energy from clean sources.
In 2020, a pilot test of an emissions trading system for Mexico was begun. The purpose of this program is to phase in a system of emissions trading in our country pursuant to the General Law on Climate Change.
The pilot phase of the project will last for three years, from 2020 through 2022, during which the Ministry of Agriculture and Natural Resources will test the design and rules for assessing the performance of the instrument, and then to propose adjustments of the subsequent operating phase after 2022.
EM-MM-110a.1.-3
Two of our business units will be participating in this pilot phase, which together account for 79% of Peñoles’ direct emissions.
In 2020, our scope 1 and 2 GHG emissions totaled 2.2 million metric tons of CO2e caused by the burning of fuel, process emissions and electrical energy consumption. They include emissions of CO2, CH4 and N2O, expressed in metric tons of carbon dioxide equivalent (CO2e). We are using 2010 as the base year.
| tCO2e | tCO2 | tCH4 | tN2O | ||
|---|---|---|---|---|---|
| Direct (Scope 1) | |||||
| Stationary sources |
Heating and generation of steam in productive processes |
492,268.01 |
491,183.41 |
17.28 |
2.27 |
| Dolomite calcination | 92,563.22 |
92,563.22 |
|||
| Direct emission from processes: Reduction of smelted metal with coke-oven tar, metallurgical coke or pet-coke, use of calcium carbonate, use of sodium carbonate |
32,033.91 |
32,021.82 |
0.15 |
0.03 |
|
| Mobile sources | Transportation of materials and personnel | 51,265.52 |
50,376.19 |
3.96 |
2.94 |
| Contractors | 4,559.78 |
4,487.59 |
0.27 |
0.24 |
|
| Subtotal | 672,690.43 |
670,632.23 |
21.67 |
5.48 |
|
| Indirect (Scope 2) | |||||
| Electrical energy consumption | 1,555,916.62 |
1,551,998.31 |
44.44 |
10.09 |
|
| Total | 2,228,607.05 |
2,222,630.54 |
66.11 |
15.57 |
|
Deposit of material at the Milpillas mine yards
0.22tCO2e/t
indicator GHG in 2020.
2020
a pilot test of an emissions trading system for Mexico was begun. The purpose of this program is to phase in a system of emissions trading in our country.
In 2021 we expect to increase the proportion of electrical energy we consume from clean sources, aiming for a target of 100% by 2028.
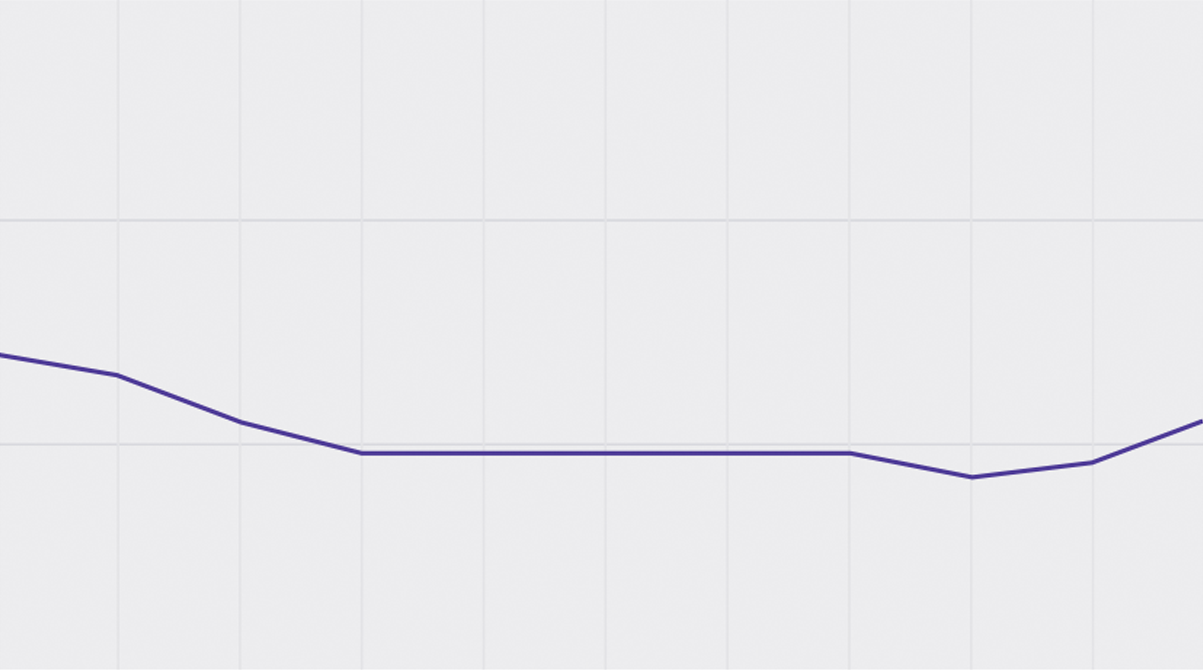
GHG EMISSIONS ECO-EFFICIENCY INDEX
(tCO2e/t)
0.6
0.4
0.2
0
2010
2011
2012
2013
2014
2015
2016
2017
2018
2019
2020
| 2010 | 2011 | 2012 | 2013 | 2014 | 2015 | 2016 | 2017 | 2018 | 2019 | 2020 | |
|---|---|---|---|---|---|---|---|---|---|---|---|
| GHG emissions (tCO2e/ t) production |
0.28 |
0.26 |
0.22 |
0.19 |
0.19 |
0.19 |
0.19 |
0.19 |
0.17 |
0.18 |
0.22 |
Data includes information only from Peñoles operations. Does not include Fresnillo plc
EM-MM-110a.1.-2,
The methodologies used were established by the Greenhouse Gas Protocol in its document A Corporate Accounting and Reporting Standard published by the World Business Council for Sustainable Development (WBCSD), and the World Resources Institute (WRI). It also incorporates information published by the Intergovernmental Panel on Climate Change (IPCC) and Mexican regulations issued on the matter. CO2e emissions were calculated considering CO2, CH4 and N2O.
In the case of CO2e emissions from dolomite calcination, we used the IPCC emission factor from chapter 2, “Mineral industry emissions,” an average estimate of the purity of the material and mineral losses in the chemical reaction. To calculate the GHG emission factor of Termoeléctrica Peñoles, we used the emission factor this facility supplied.
305-6
Note that Peñoles does not emit substances that deplete the ozone layer.
305-4, 305-5, EM-MM-110a.2.-2
We continue to implement good practices on the efficient use of energy and fuel. We have an indicator for the generation of direct and indirect GHG emissions relating to metric tons of our leading products. In 2020, this indicator rose to 0.22 tCO2e, primarily due to increased energy consumption in our zinc plant and the fact that the CFE has not yet assigned the clean energy from the Mesa La Paz wind farm for reasons relating to processing formalities. Other factors included the suspension of operations at Madero and Milpillas, and the startup of the new Capela mine.
EM-MM-110a.2.-1
In 2021 we expect to increase the proportion of electrical energy we consume from clean sources, aiming for a target of 100% by 2028. This will reduce our scope 2 emissions while we search for alternatives to also cut down on our scope 1 emissions.
Interior view from Sabinas
In this 2020 Report we present the sustainability performance of the operations of Peñoles and the generation of shared value with the groups of interest.