STRENGTHENED BY

At Peñoles, we work in a socially responsible and ethical manner, and generate shared value for our stakeholders.
US $4.67B
in ordinary sales revenues.
FOURTH FINANCIAL STATEMENT
102-7-a.iv, 102-45, 103-1, 103-2, 103-3,
201-1-a, 203-1, 203-2
At Peñoles, we work in a socially responsible and ethical manner, and generate shared value for our stakeholders: shareholders, employees, communities, customers, suppliers, government and financial institutions.
The Fourth Financial Statement1,2, presented here shows the value generated by Peñoles and contributed to Mexico’s economic development, and how it was distributed among its various stakeholders:
Technical notes:The attached notes are an integral part of the Fourth Financial Statement and explain the details about the components of value generation and distribution.
More information about the macroeconomic environment, as well as of the company’s operating and financial performance can be found in the 2020 Annual Report and at www.peñoles.com.mx
| 2020 | % | 2019 | % | |
|---|---|---|---|---|
| Net sales | 4,673,309 | 100 | 4,471,948 | 100 |
| Domestic costs and expenses | 1,649,056 | 40 | 1,773,055 | 40 |
| Foreign costs and expenses | 224,871 | 5 | 241,780 | 5 |
| Total costs and expenses | 1,873,927 | 45 | 2,014,835 | 45 |
| Total value generated | 2,799,382 | 55 | 2,457,113 | 55 |
* Data include operations of Industrias Peñoles and its subsidiaries.
| 2020 | % | 2019 | % | |
|---|---|---|---|---|
| Employees | 383,813 | 13.71 | 392,632 | 16.0 |
| Contractors | 904,904 | 32.33 | 1,034,101 | 42.1 |
| Government | 243,597 | 8.70 | 18,430 | 0.8 |
| Shareholders | 33,842 | 1.21 | 236,858 | 9.6 |
| Community and environment | 63,061 | 2.25 | 77,154 | 3.1 |
| Reinvestment in the company | 887,206 | 31.69 | 591,889 | 24.1 |
| Interest | 282,959 | 10.11 | 106,049 | 4.3 |
| Total value distributed | 2,799,382 | 100 | 2,457,113 | 100 |
* Data include operations of Industrias Peñoles and its subsidiaries.
US$ 2.8 B
total value generated and distributed among stakeholders.
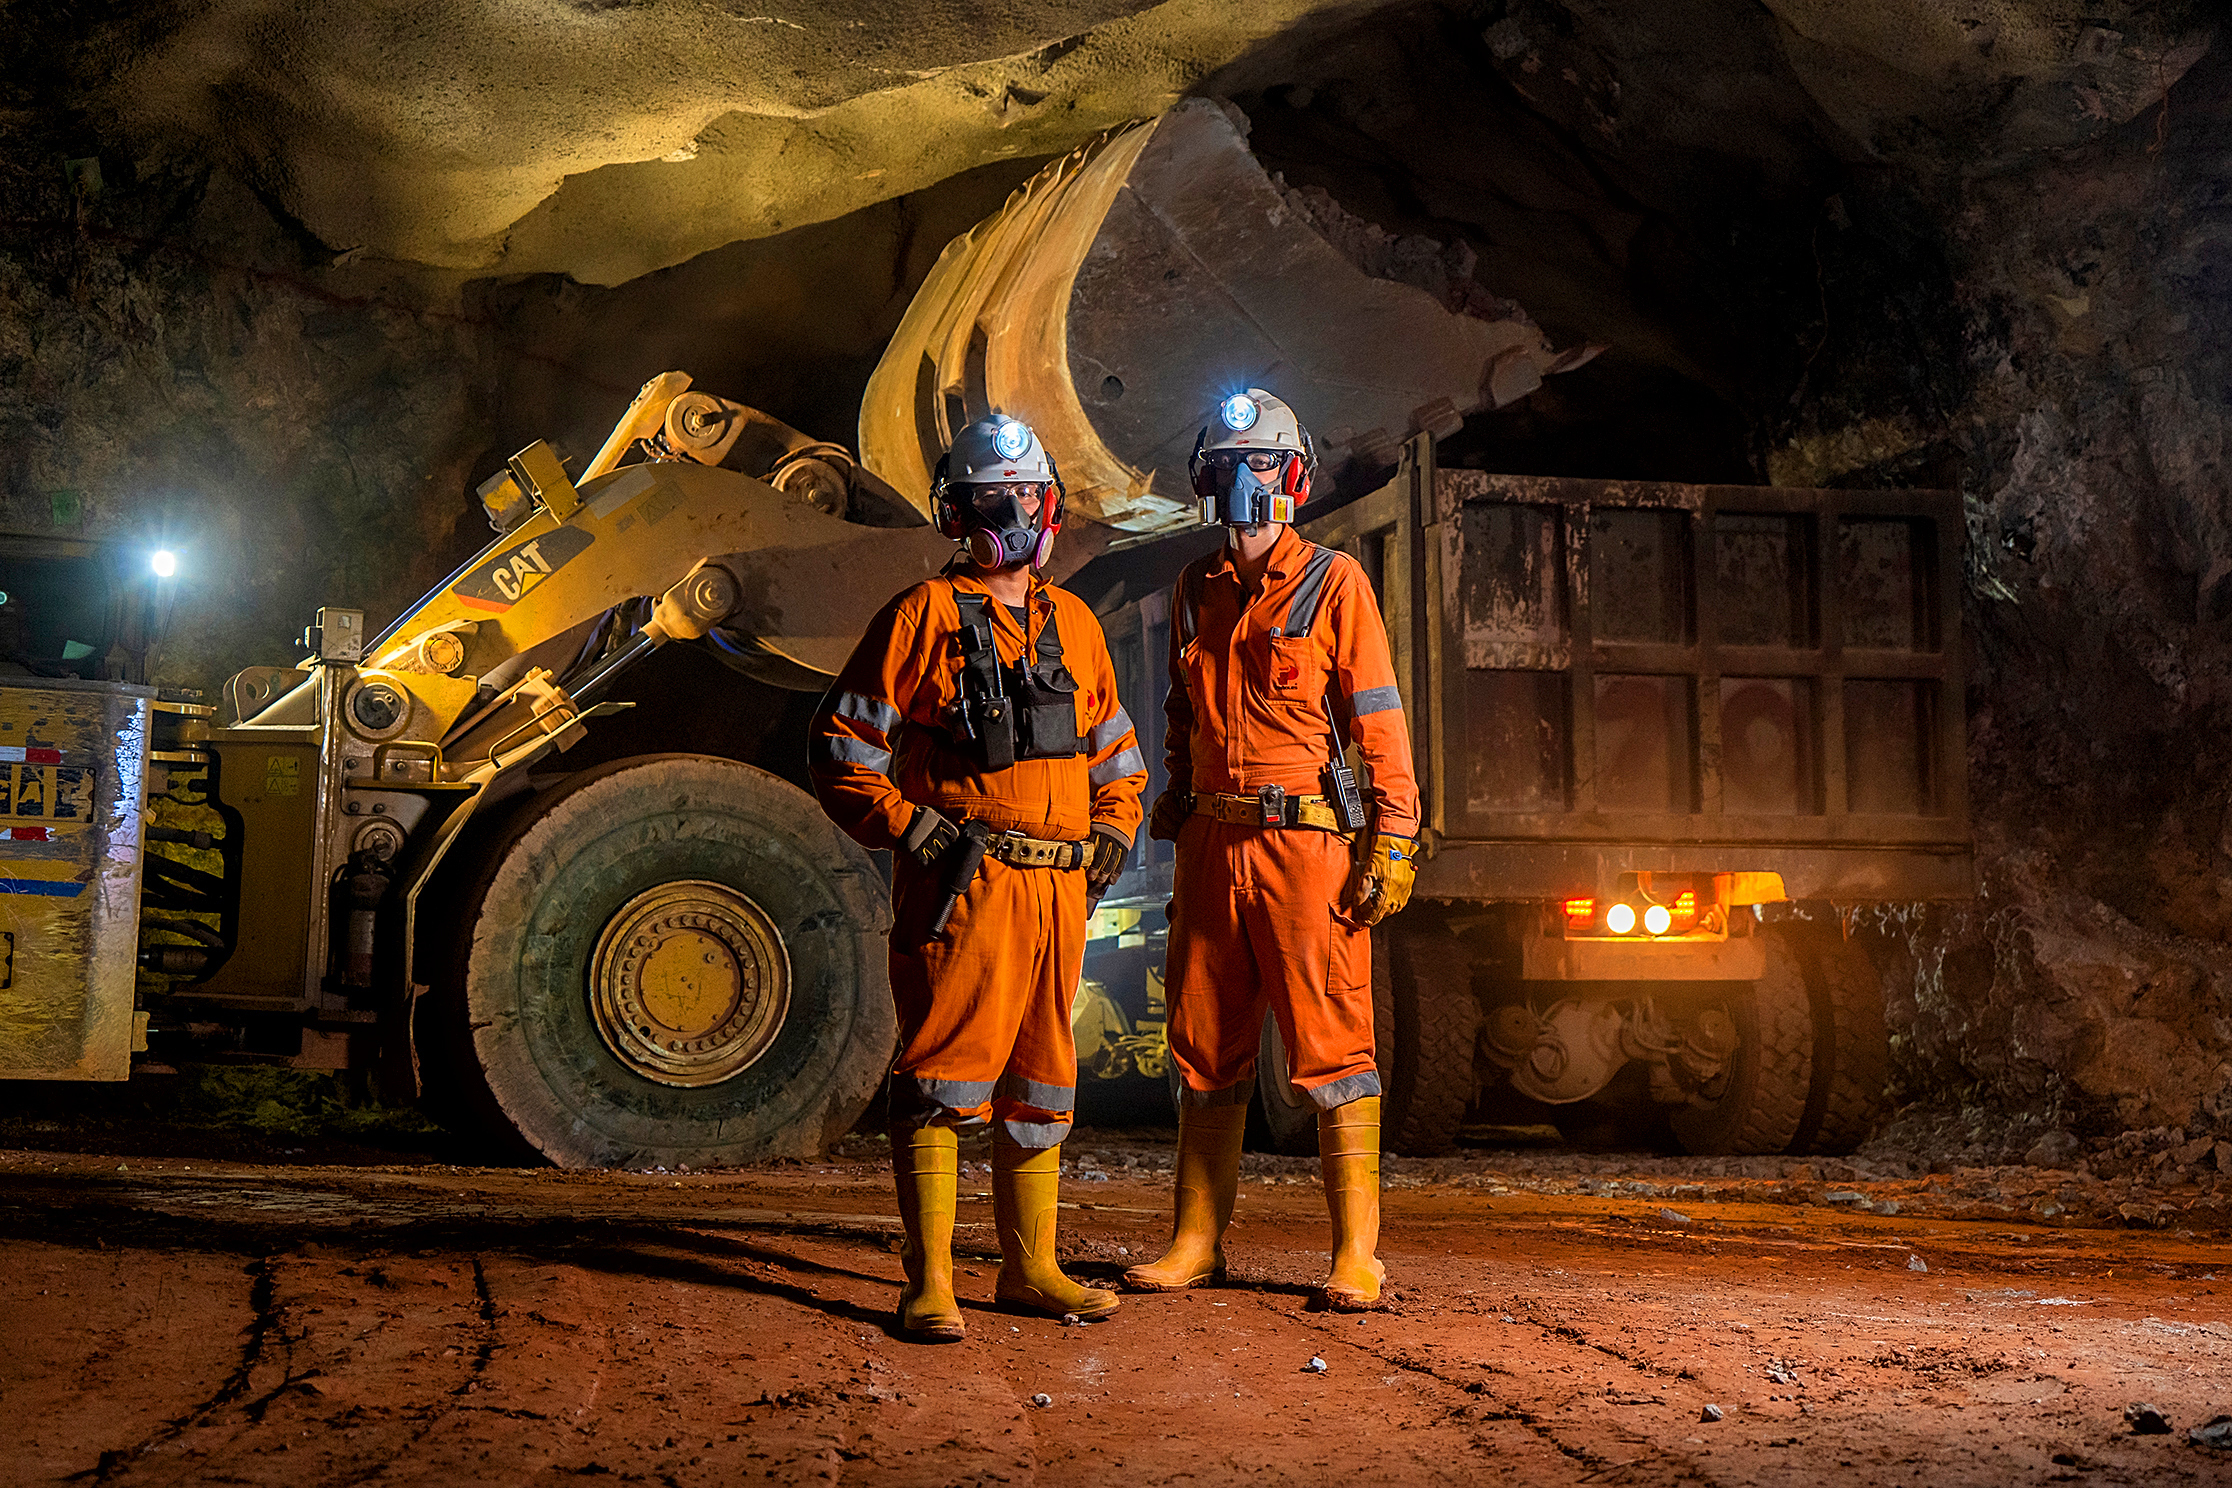
Work team Level 1520, Milpillas mine
Note 1: Origin of revenue
a) Revenue
In 2020, we reported a total of US$ 4.67 billion in ordinary sales revenues.
b) Prices
Due to the pandemic, metal prices dropped sharply, particularly in the first quarter of the year. In the case of industrial metals, prices recovered gradually; zinc and lead quotations recovered some of their value, but on average ended the year 11.2% and 8.7% lower, respectively, than the year before. For copper, with better market conditions, the average price grew slightly (2.7%). As for precious metal prices, although they dropped initially, they recovered to levels higher than in the recent past. The price of silver gained 27.7%, and gold, considered a safe haven asset, increased 27.1%, buoyed by widespread uncertainty over the pandemic.
c) Production
Refined gold output fell to 957,209 ounces (-14.0%), due primarily to lower treatment of doré at the Herradura and Noche Buena mines. Some remitters temporarily suspended the supply of concentrates, and although the situation returned to normal around mid-year, we had some trouble supplying the necessary amount and quality needed for mixtures to be processed at the lead smelting plant. With this, lead and silver production declined by 2.4% and 6.2%, to 70.6 million ounces and 111,538 metric tons, respectively, from their levels in the previous year.
The following details show how revenue was generated according to the different markets we supply.
| 2020 | % | 2019 | % | |
|---|---|---|---|---|
| Domestic | 629,201 | 13 | 711,611 | 15.91 |
| United States | 2,347,724 | 50 | 3,060,145 | 68.43 |
| Asia | 429,632 | 9 | 287,426 | 6.43 |
| Europe | 629,123 | 13 | 371,330 | 8.30 |
| South America | 40,493 | 1 | 20,897 | 0.47 |
| Canada | 583,362 | 12 | 433 | 0.01 |
| Others | 13,774 | 0 | 20,106 | 0.45 |
| Total | 4,673,309 | 100 | 4,471,948 | 100 |
| Product | 2020 | 2019 |
|---|---|---|
| Silver | 31 | 26 |
| Gold | 35 | 35 |
| Zinc | 13 | 16 |
| Lead | 5 | 6 |
| Ore concentrates | 7 | 7 |
| Copper | 2 | 3 |
| Sodium sulfate | 2 | 3 |
| Other products | 5 | 5 |
| Total | 100 | 100 |
27.7%
increase in price of silver and 27.1% in gold.
Note 2: Cost components
a) Costs
The following table shows the change in costs for the years 2020 and 2019:
| 2020 | % | 2019 | % | |
|---|---|---|---|---|
| Metal | 1,019,928 | 1,019,928 | 945,992 | 47 |
| Energy | 378,985 | 20 | 416,381 | 21 |
| Operating materials | 345,973 | 18 | 374,662 | 19 |
| Raw materials | 31,428 | 2 | 34,063 | 2 |
| Others | 97,613 | 5 | 243,737 | 12 |
| Total | 1,873,927 | 100 | 2,014,835 | 100 |
The following tables describe the breakdown of energy resources, operating materials and raw materials:
| 2020 | 2019 | |
|---|---|---|
| Electricity | 211,435 | 191,564 |
| Natural gas | 21,710 | 26,599 |
| Coke | 18,363 | 21,809 |
| Diesel | 111,753 | 155,682 |
| Fuel and lubricants | 15,724 | 20,726 |
| Total | 378,985 | 416,380 |
| 2020 | 2019 | |
|---|---|---|
| Explosives and detonators | 49,127 | 61,191 |
| Balls and bar mills | 35,844 | 35,682 |
| Tires and inner tubes | 17,598 | 19,173 |
| Other materials | 14,709 | 14,856 |
| Sodium cyanide | 23,456 | 26,502 |
| Steel and drilling bits | 14,967 | 16,589 |
| Slaked lime | 7,130 | 8,218 |
| Cement | 3,286 | 4,583 |
| Safety equipment | 13,620 | 14,273 |
| Other reagents | 24,514 | 25,062 |
| Steel and iron | 7,446 | 10,908 |
| Hoses and accessories | 7,331 | 11,527 |
| Construction materials | 8,920 | 11,014 |
| Magnesium-calcium alloy | 2,119 | 2,434 |
| Zinc | 5,060 | 6,004 |
| Mills and crusher armor | 14,879 | 15,468 |
| Anchors | 8,704 | 11,586 |
| Others | 87,263 | 79,591 |
| Total | 345,973 | 374,661 |
| 2020 | 2019 | |
|---|---|---|
| Ammonia | 19,599 | 21,421 |
| Copper cement | 4,404 | 3,906 |
| Magnesium oxide | 4,226 | 5,331 |
| Zinc slag | 1,514 | 1,682 |
| Sulfuric acid | 214 | 175 |
| Others | 1,471 | 1,547 |
| Total | 31,428 | 34,062 |
b) Purchases
We had a total of 30,498 suppliers, more than the 29,890 of the previous year. The breakdown of suppliers by type of purchase for 2020 and 2019 is detailed in the following table:
| 2020 | % | 2019 | % | |
|---|---|---|---|---|
| Supplies | 11,055 | 36.2 | 10,881 | 36.4 |
| Transport | 1,202 | 3.9 | 1,193 | 4.0 |
| Contractors | 1,389 | 4.6 | 1,358 | 4.5 |
| Customs agents | 216 | 0.7 | 213 | 0.7 |
| Services | 16,094 | 52.8 | 15,709 | 52.6 |
| Fixed assets | 40 | 0.1 | 40 | 0.1 |
| Concentrates | 502 | 1.6 | 496 | 1.7 |
| Total | 30,498 | 100 | 29,890 | 100 |
Peñoles promotes the country’s development by creating jobs and business opportunities for different domestic industries. We have domestic suppliers distributed across Mexico.
As for suppliers outside of Mexico, the United States ranks first, with 58% of the total, followed by Canada, with 9%, the United Kingdom with 5% and other 64 countries collectively accounting for the remaining 28%.
Note 3: Value distribution indicators
a) Employees
At Peñoles, we generate dignified and fair job opportunities. During 2020 we paid a total of US$ 383.8 million to direct employees and other employees working for the company.
| 2020 | 2019 | |
|---|---|---|
| Wages | 108,056 | 114,553 |
| Salaries | 57,092 | 59,000 |
| Benefits | 90,816 | 96,956 |
| Subtotal | 255,964 | 270,509 |
| Overtime | 15,126 | 14,352 |
| Other benefits | 83,119 | 89,705 |
| Profit-sharing | 29,604 | 18,066 |
| Total | 383,813 | 392,632 |
b) Contractors
In 2020, we paid a total of US$ 904.9 million for outsourced services. The following table shows the different services received and amounts paid:
| 2020 | % | 2019 | % | |
|---|---|---|---|---|
| Development and works | 455,197 | 50 | 504,078 | 49 |
| Maintenance | 240,069 | 27 | 264,915 | 26 |
| Major repairs | 70,359 | 8 | 77,137 | 7 |
| Fees | 77,859 | 9 | 87,458 | 8 |
| Security | 16,627 | 2 | 16,786 | 2 |
| Other items | 44,793 | 5 | 83,727 | 8 |
| Total | 904,904 | 100 | 1,034,101 | 100 |
c) Government
Total tax payments in 2020 were US$ 243.6 million.
d) Shareholders
Peñoles is a public company whose shares have been listed on the Mexican Stock Exchange (BMV) since 1968 under the PE&OLES ticker symbol.
| 2020 | 2019 | |
|---|---|---|
| Shareholders - controlling entity | 3 | 155,243 |
| Non-controlling interest | 33,839 | 81,615 |
| Total | 33,842 | 236,858 |
e) Community and the environment
The following table reflects the different contributions made by the company in connection with our responsible and sustainable commitment to the environment:
| 2020 | 2019 | |
|---|---|---|
| Community | 7,984 | 11,232 |
| Environment | 6,967 | 7,561 |
| Depreciation of social assets | 56,098 | 47,368 |
| Provision for ecological expense | -7,988 | 10,993 |
| Total | 63,061 | 77,154 |
US$ 296 million in fixed assets for social use or social purposes.
In accordance with the Peñoles Sustainable Development Policy, there is a provision that is used to progressively restore the mining units up to the date when it is estimated that their mineral reserves will be depleted. In 2020, this provision totaled US$ 460.6 million.
f) Reinvestment in the company
Items that provide for the regeneration or survival of the company’s production capacity, capital or social value are included; essentially, earnings net of dividend distribution and fiscal year depreciations (including the results in the cancellation of fixed assets)
| 2020 | 2019 | |
|---|---|---|
| Depreciation, amortization, depletion and others |
955,432 | 793,275 |
| Income from operations | -34,384 | 35,472 |
| Less controlling entity shareholder dividends and noncontrolling interest |
-33,842 | -236,858 |
| Total | 887,206 | 591,889 |
US$ 383 M
paid to direct employees in 2020.
US$ 904.9 M
paid to contractors.
Retained earnings remain at the disposal of the Board of Directors, in accordance with the powers delegated to it by the Shareholders Meeting.
g) Interests
In 2019 and 2020 we paid US$ 106 and US$ 283 million, respectively in interest payments and foreign exchange losses. It also considers the company’s obligations to financial institutions and other capital suppliers or third-party financing and the payment of special, additional and extraordinary rights to mining companies for the constitution of the Mining Fund for Sustainable Regional Development, whose investment goal is to favor physical investment with a positive social, environmental and urban development impact for mining municipalities.
In this 2020 Report we present the sustainability performance of the operations of Peñoles and the generation of shared value with the groups of interest.