WASTE AND
RECYCLED BY PRODUCTS
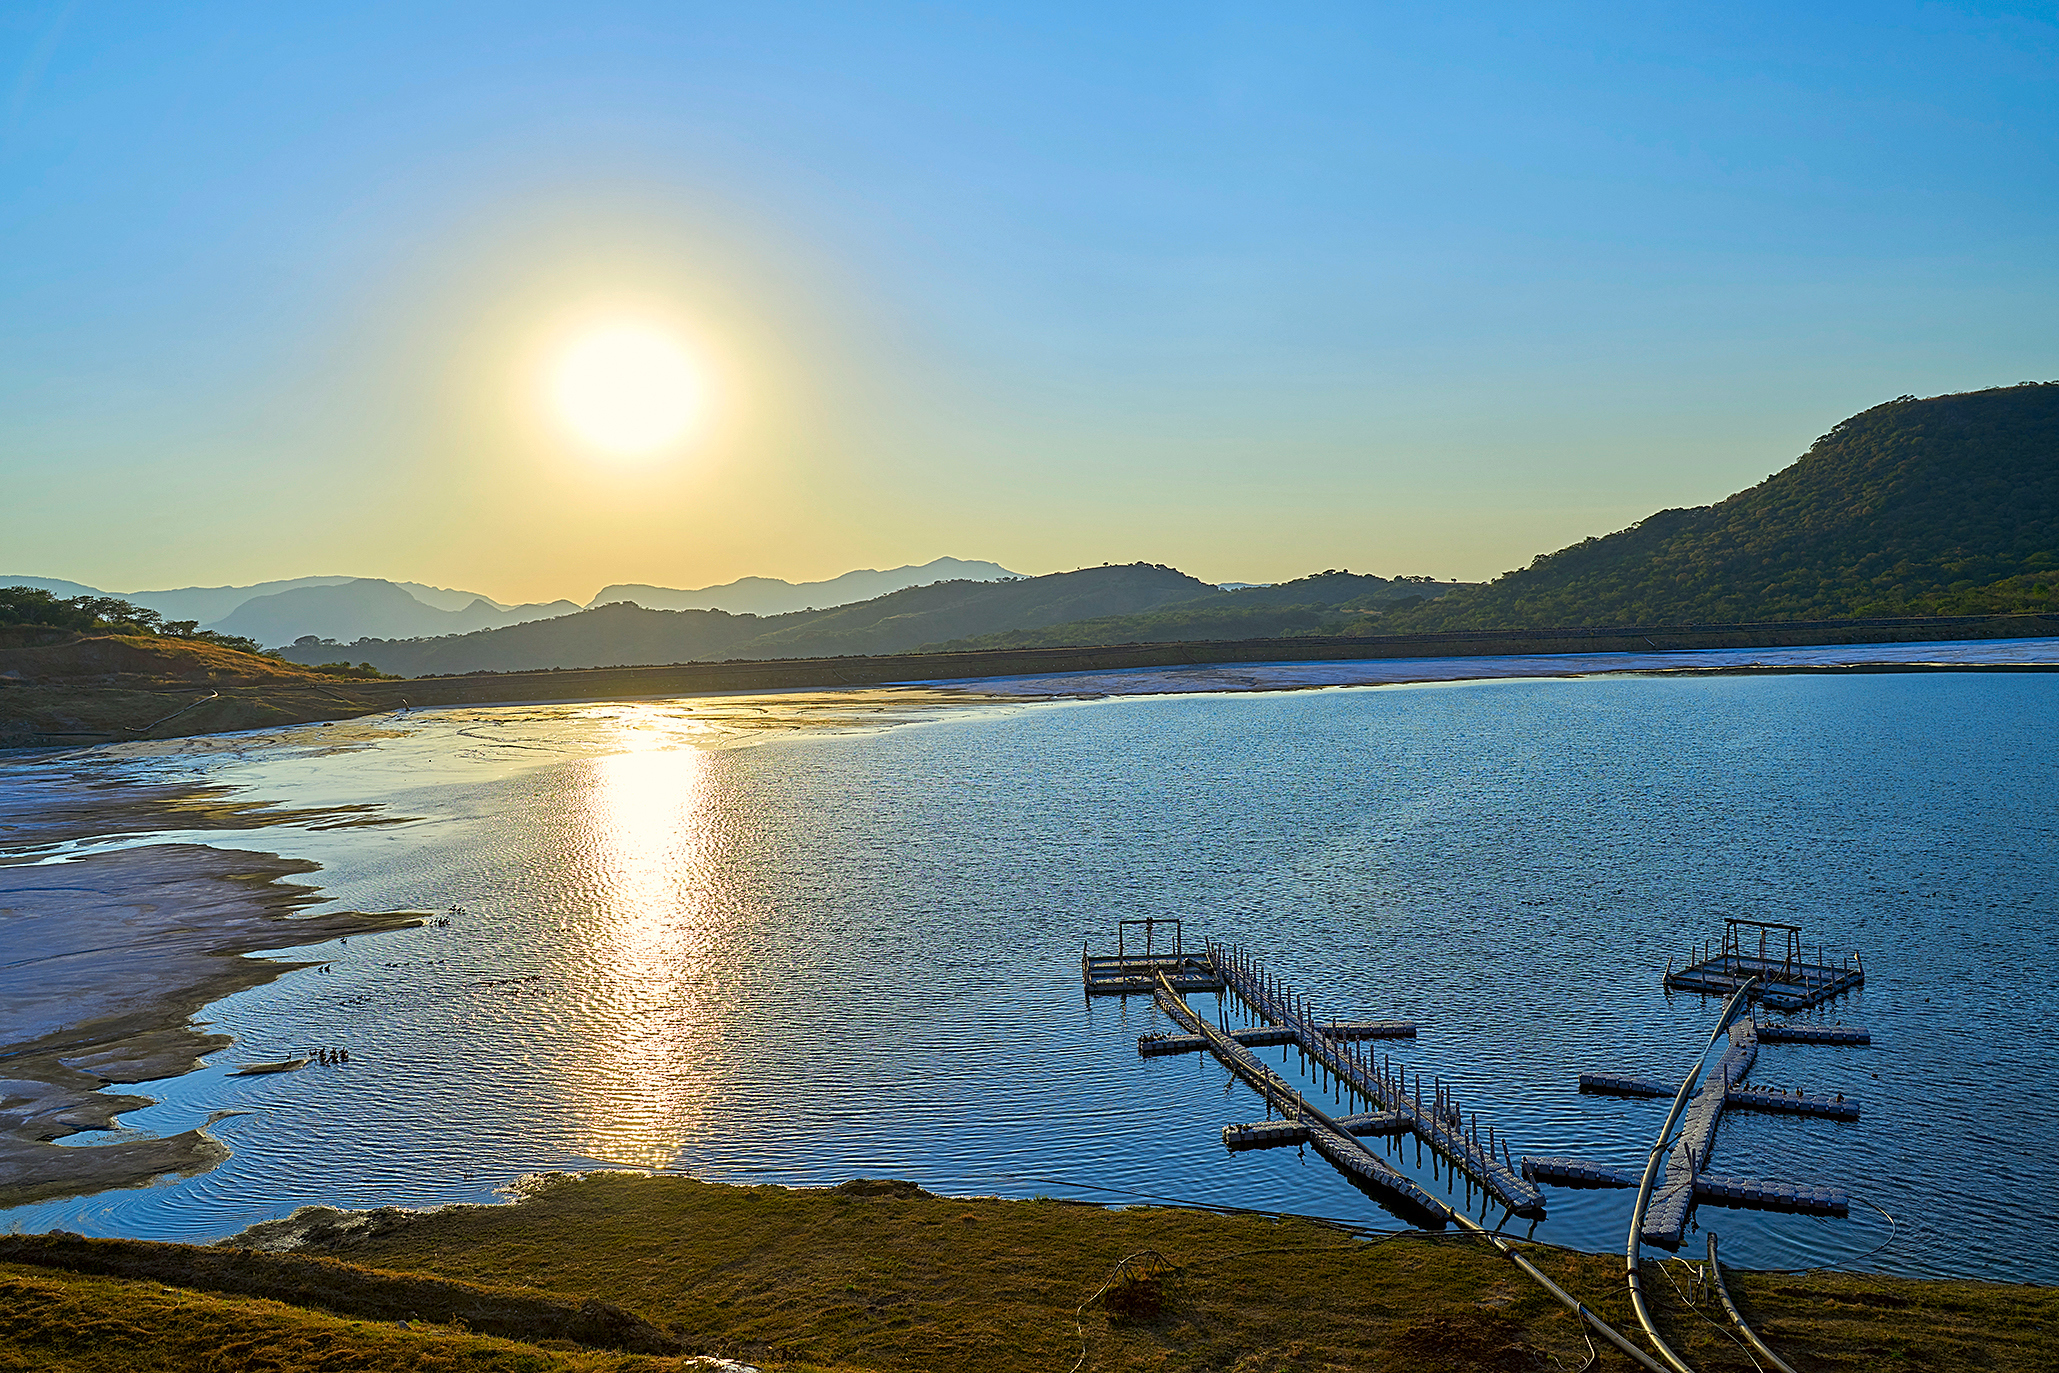
Tailings aerial view, Capela unit
WASTE AND
RECYCLED BY PRODUCTS
| Materials | Orign: |
Source: |
2019 |
2020 |
Unit |
|---|---|---|---|---|---|
| Raw materials * | I | NR | 10,474,260.31 |
7,743,790.68 |
t |
| Raw materials | I | NR | 4,715,712.71 |
4,939,064.64 |
m3 |
| Raw materials | I | R | 154,840.00 |
174,340.00 |
m3 |
| Raw materials | I | R | 15,290.88 |
23,895.00 |
t |
| Semi-manufactured materials | E | NR | 183,028.71 |
399,088.58 |
t |
| Semi-manufactured materials | E | NR | 0.52 |
286.21 |
m3 |
| Semi-manufactured materials | E | R | 82,335,748.61 |
81,902,906.46 |
m3 |
| Associated materials * | E | NR | 8,545.43 |
15,290.96 |
m3 |
| Associated materials * | E | NR | 1,013,828.36 |
301,726.18 |
t |
| Associated materials | E | NR | 1,335,066.00 |
938,898.83 |
m |
| Associated materials | E | NR | 8,734,624.00 |
4,299,970.00 |
pzas |
| Associated materials | E | R | 8,930.83 |
9,122.67 |
t |
| Empaques | E | NR | 22.33 |
8.47 |
t |
| Empaques | E | R | 327.31 |
247.44 |
t |
* These amounts were modified due to a double-counting correction in the semi-manufactured and associated internal materials, and were therefore eliminated from the table reported in the previous year.
Also in the case of the data reported in 2019 for Raw Materials and External Associates, corrections were made due to the reclassification of some materials.
301-1
The processes we operate and the products we make require various raw materials and inputs, most of which are non-renewable (metallic ores). This is the nature of our business, and it corresponds to the needs of global society. With this in mind we try to optimize our use of these resources.
103-1, 103-2, 103-3, 306-1
Peñoles handles and disposes of its waste appropriately, and continually works to reduce and recycle it. We have introduced risk management policies that deal with the safety of our tailings dams, and to manage our supply, transport, use and elimination of chemical products and byproducts from mining and metal processing, reducing the associated risks.
306-4, G4-MM3
Most of the waste we generate is in the form of mineral impurities that we extract: the tailings produced by the concentration of metal ores; grease from furnaces, sludge and jarosite from our metallurgical processes; and dolomite powder, quicklime, lime ash and gypsum from chemical processes. All of this waste is handled as directed by applicable regulations and authorized handling plans.
As a first option, Peñoles looks for internal alternatives where the waste can be put to use; when these are not available, it looks for external recycling options. Materials that cannot be used are confined safely and in a controlled manner.
2018 |
2019 |
2020 |
||||
|---|---|---|---|---|---|---|
| Materials recycled internally | t |
% |
t |
% |
t |
% |
| Scrap | 33.34 |
100.00 |
18.62 |
100.00 |
8.75 |
100.00 |
| Tailings | 849,532.58 |
11.06 |
1,279,654.93 |
15.17 |
2,223,377.56 |
25.38 |
| Wood | 77.75 |
10.63 |
80.50 |
0.88 |
98.43 |
22.60 |
| Total | 849,643.67 |
1,279,754.05 |
2,223,484.74 |
|||
| Waste recycled by outside facilities | t |
% |
t |
% |
t |
% |
| Used oils | 589.68 |
97.52 |
624.77 |
98.32 |
429.81 |
98.06 |
| Batteries | 74.88 |
93.44 |
29.67 |
84.66 |
22.06 |
68.33 |
| Cardboard and paper | 29.75 |
100.00 |
41.77 |
98.12 |
62.24 |
98.79 |
| Scrap | 5429.5 |
100.00 |
4017.7 |
100.00 |
3263.76 |
100 |
| Materials impregnanted with hydrocarbons |
191.45 |
50.58 |
212.11 |
57.77 |
105.05 |
33.62 |
| Contaminated rubble (refractory brick) |
2685.423 |
98.27 |
0 |
0.00 |
0.00 |
0 |
| Wood | 139.89 |
19.10 |
8714.02 |
95.32 |
166.14 |
36.64 |
| PET | 134 |
92.41 |
62.52 |
99.69 |
41.76 |
99.53 |
| Used tires | 22.02 |
59.59 |
52.57 |
50.82 |
73.29 |
94.16 |
| Materials with paint | 3.1 |
23.44 |
1.89 |
9.84 |
1.98 |
3.86 |
| Electronic waste | 12.6 |
97.83 |
26.24 |
91.65 |
18.57 |
89.84 |
| Miscellaneous | 8.73 |
100.00 |
0.09 |
100.00 |
5.04 |
80.25 |
| Total | 9,321.02 |
13,783.35 |
4,189.70 |
EM-MM-150a.1
In 2020, the Mines Division generated 6.27 million metric tons of tailings; metal processing generated 1.12 million metric tons. In mining activity we recycled 2.22 million metric tons of tailings (25.38% of the total), up from 15.17% last year (1.28 million metric tons).
Even when, by the nature of our processes, the materials we monetize cannot be used as replacements for raw materials or inputs, we can reprocess some waste by turning it into byproducts or end products.
306-2
The total amount of waste generated in 2020 was 10.13 million metric tons, broken down as shown in the following chart.
| Division | Type of disposal | 2019 |
2020 |
% |
|---|---|---|---|---|
| Mines | Landfill | 7,159,912 |
6,330,409 |
73.98 |
| Mines | Recycled outside facilities |
2,878 |
2,553 |
0.03 |
| Mines | Recycled internally |
1,279,655 |
2,223,485 |
25.99 |
| Metals | Landfill |
1,013,768 |
1,369,564 |
99.89 |
| Metals | Recycled outside facilities |
10,521 |
1,402 |
0.10 |
| Metals | Recycled internally |
99 |
107 |
0.01 |
| Chemicals | Landfill |
274,318 |
207,188 |
99.89 |
| Chemicals | Recycled outside facilities |
384 |
235 |
0.11 |
| Chemicals | Recycled internally |
- |
- |
0.00 |
| Total Peñoles | Landfill |
8,448,076 |
7,907,161 |
78.02 |
| Total Peñoles | Recycled outside facilities |
13,783 |
4,190 |
0.05 |
| Total Peñoles | Recycled internally |
1,279,754 |
2,223,592 |
21.94 |
Total |
9,741,614 |
10,134,942 |
100.0 |
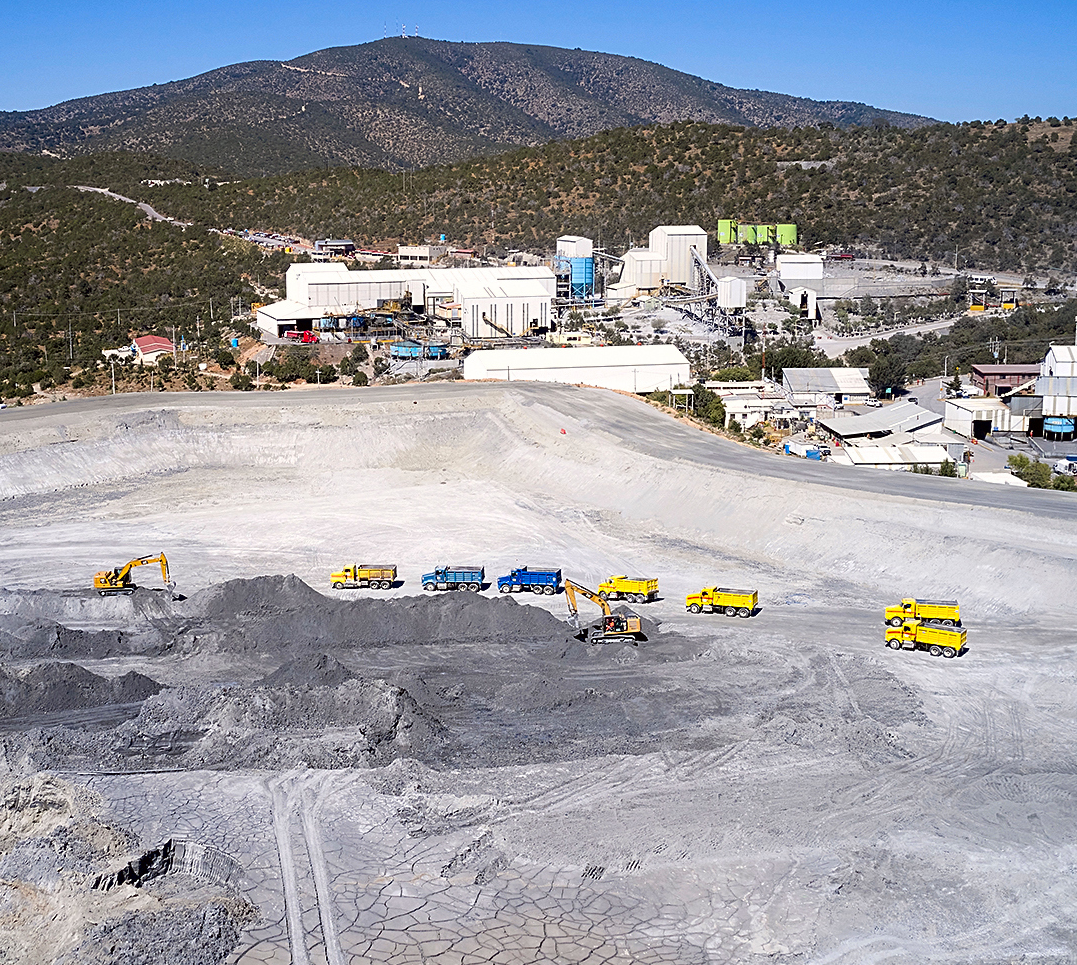
WASTE DISPOSAL
(%)
78.02
0.04
21.94
| Confined waste |
| Materials recycled internally |
| Waste recycled by outside specialists |
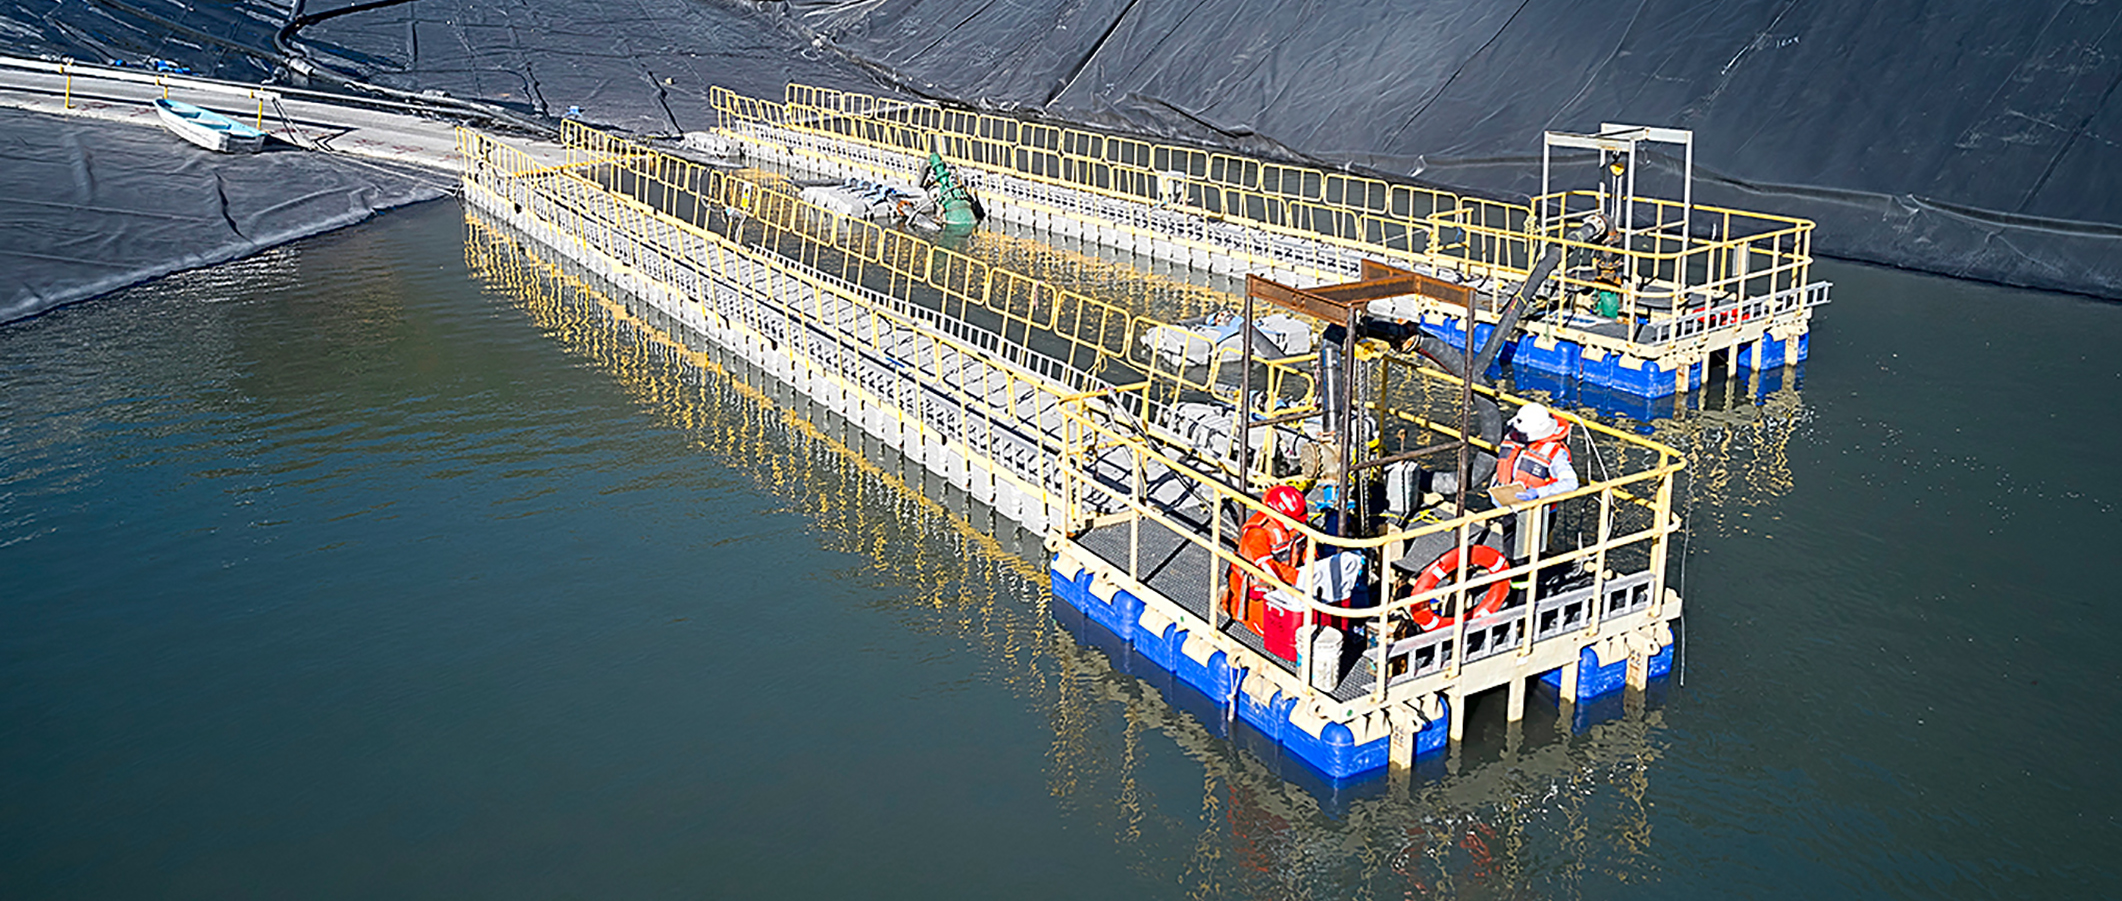
Tailings deposit, Capela unit
EM-MM-150a.2.
Our ore processing operations generated 1.37 million metric tons of waste, 0.1% of which which 1,509 metric tons were recycled.
The eco-efficiency index includes the total amount of waste generated for each metric ton of our most important products. The index in 2020 was 0.77, higher than the 0.64 reported in 2019, primarily due to the shutdown of operations at Bismark, Madero and Milpillas.
306-3
In 2020, there were no spills of hazardous materials or waste.
306-4
Peñoles verifies that the suppliers it hires to provide any type of waste handling, transport, or final disposal services, have all the necessary authorizations. The company does not export or import any type of waste.
0.77
waste eco-efficiency index in 2020.
2005 |
2006 |
2007 |
2008 |
2009 |
2010 |
2011 |
2012 |
2013 |
2014 |
2015 |
2016 |
2017 |
2018 |
2019 |
2020 |
|
|---|---|---|---|---|---|---|---|---|---|---|---|---|---|---|---|---|
| PEÑOLES | 0.73 |
0.71 |
0.65 |
0.60 |
0.57 |
0.55 |
0.58 |
0.58 |
0.61 |
0.63 |
0.63 |
0.63 |
0.63 |
0.62 |
0.64 |
0.77 |
WASTE ECO-EFFICIENCY INDEX
(t waste / t of product)
2.0
1.6
1.2
0.8
0.4
0
2005
2006
2007
2008
2009
2010
2011
2012
2013
2014
2015
2016
2017
2018
2019
2020
1,509 t
of waste recycled only from our ore processing operations.
4
dams moved from the construction phase to the operating phase.
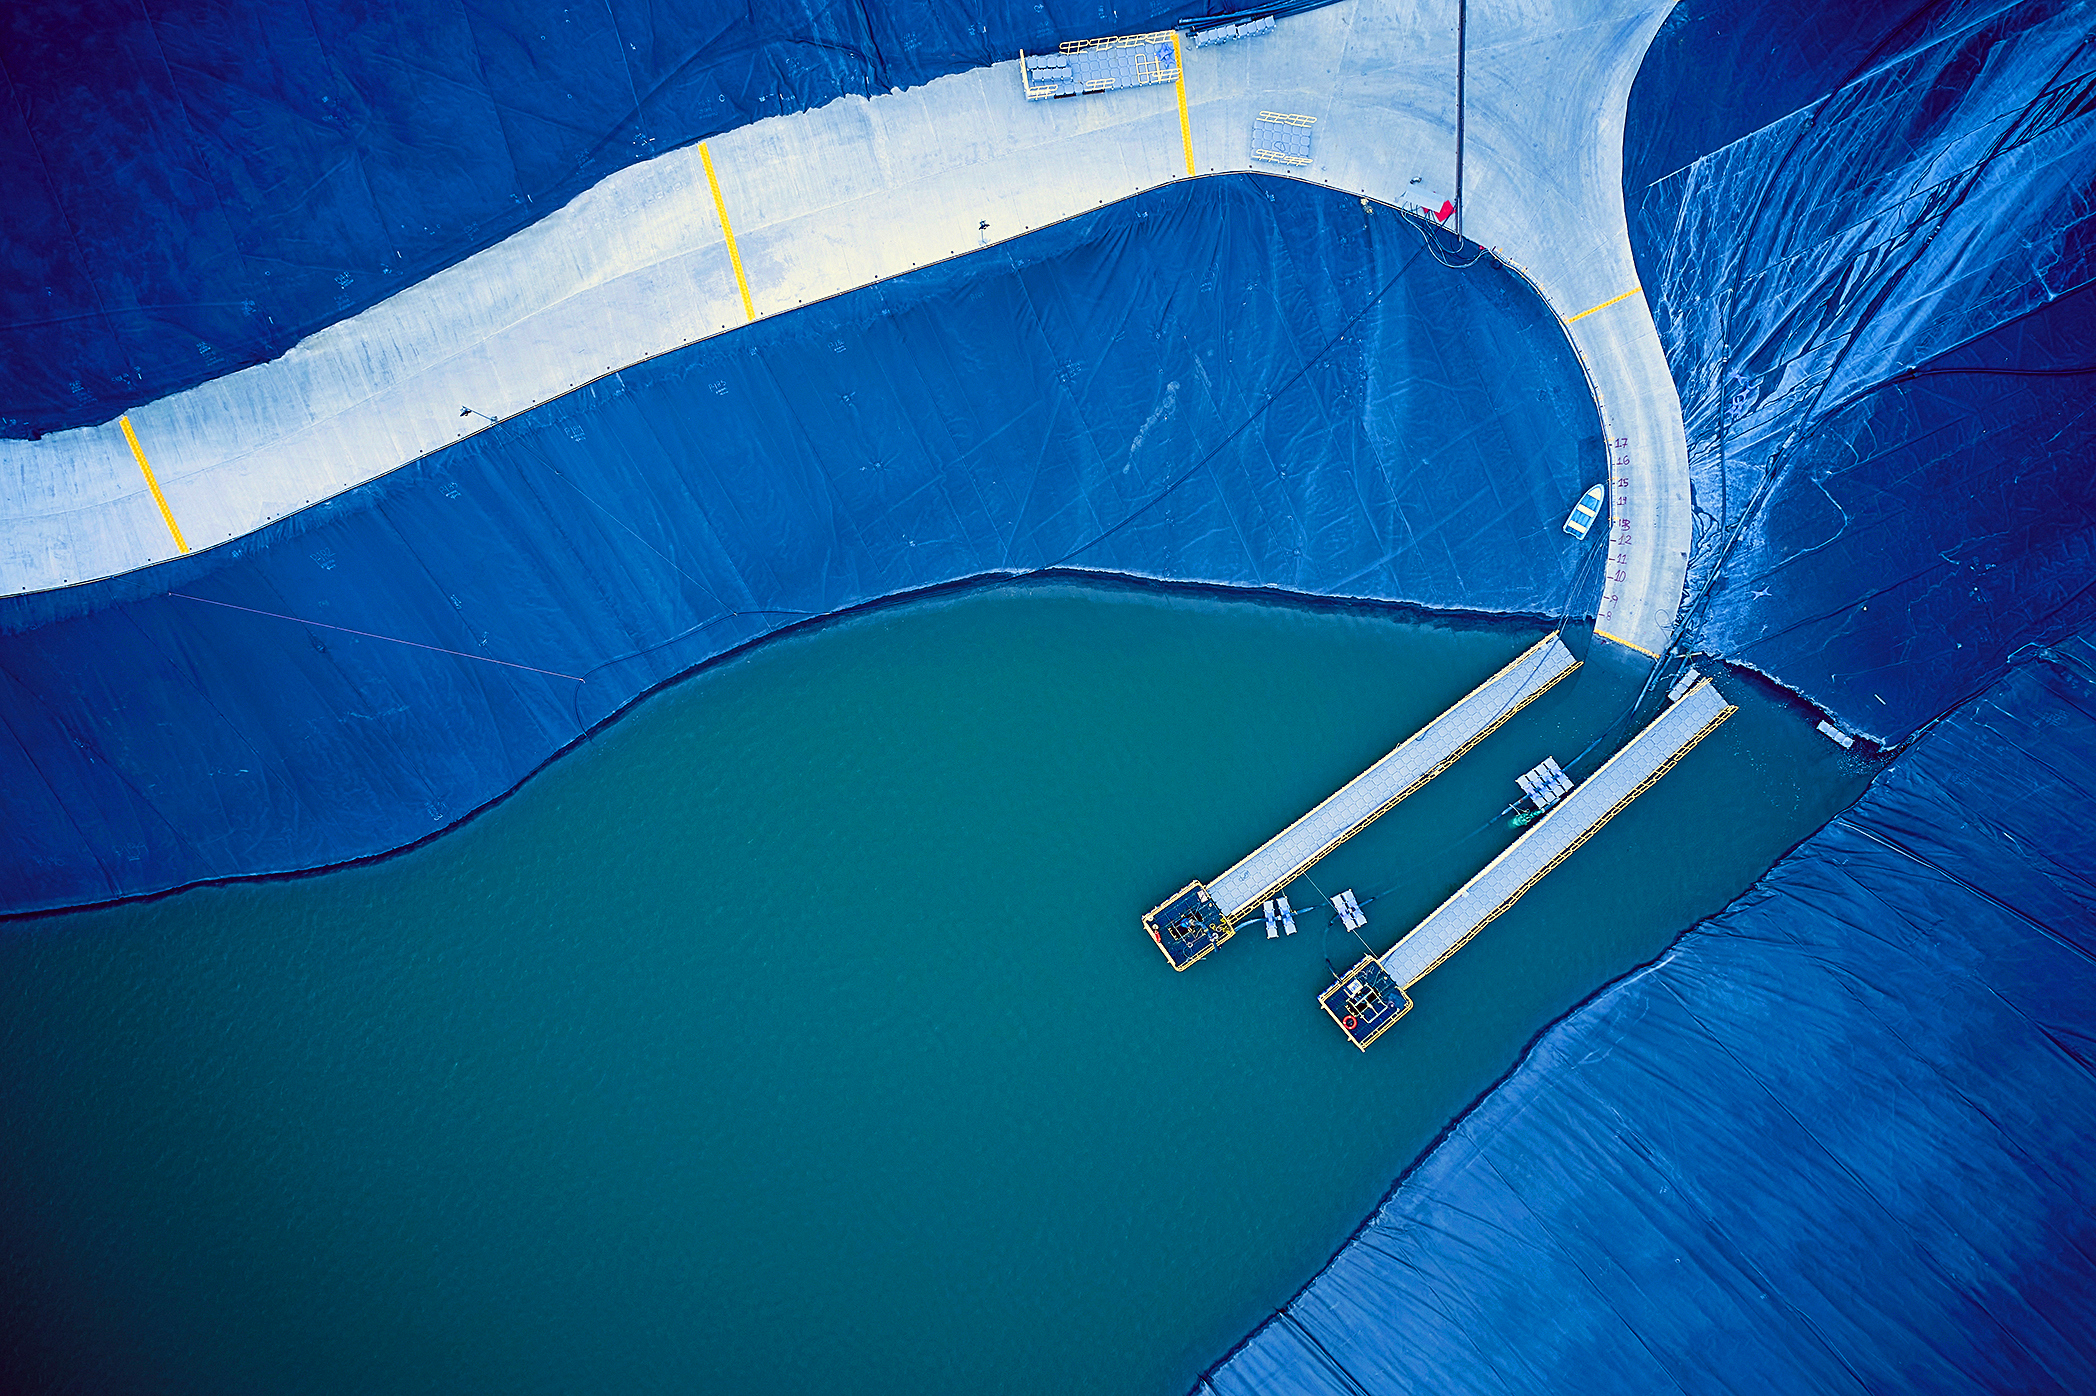
Panoramic view of tailings dam, Tizapa plant
Tailings dams
EM-MM-150a.3
Peñoles made substantial progress in implementation of a governance and management framework for tailings and mining-metallurgical waste.
The following dams moved from the construction phase to the operating phase in 2020: dam 3 at La Ciénega, San Carlos, and Fresnillo and dam 1 at Capela.
The following dams went from the operating phase to the care and maintenance phase: expansion of dam 1 at Bismark, dams 1 and 2 at Madero, San Luis, and Los Chinos at Fresnillo.
We remained up to date on the status of the Global Mining Industry Standard on Tailings Management and agreed to its principles. We are preparing a plan to implement and comply with it when possible, which depends primarily on the availability of technical resources.
Some units, like Velardeña, Fresnillo, Saucito, Sabinas, Ciénega, Capela, Tizapa and the south dam at Met-Mex, have introduced a local governance structure that incorporates the positions and duties of the dam owner—that is, the party responsible—and the engineer of record. This is consistent with the standards of the Canadian Mining Association and the Global Industry Standard on Tailings Management.
With actions like this, Peñoles proves its firm commitment to operating its tailings facilities within a governance framework aligned with the standards and rules of the International Commission on Large Dams (ICOLD), the Canadian Dam Association (CDA), the Canadian Mining Association (MAC), the International Council on Mining and Metals (ICMM), and the Global Industry Standard on Tailings Management.
SOME OF OUR FEATURED ACTIONS
In this 2020 Report we present the sustainability performance of the operations of Peñoles and the generation of shared value with the groups of interest.