WATER
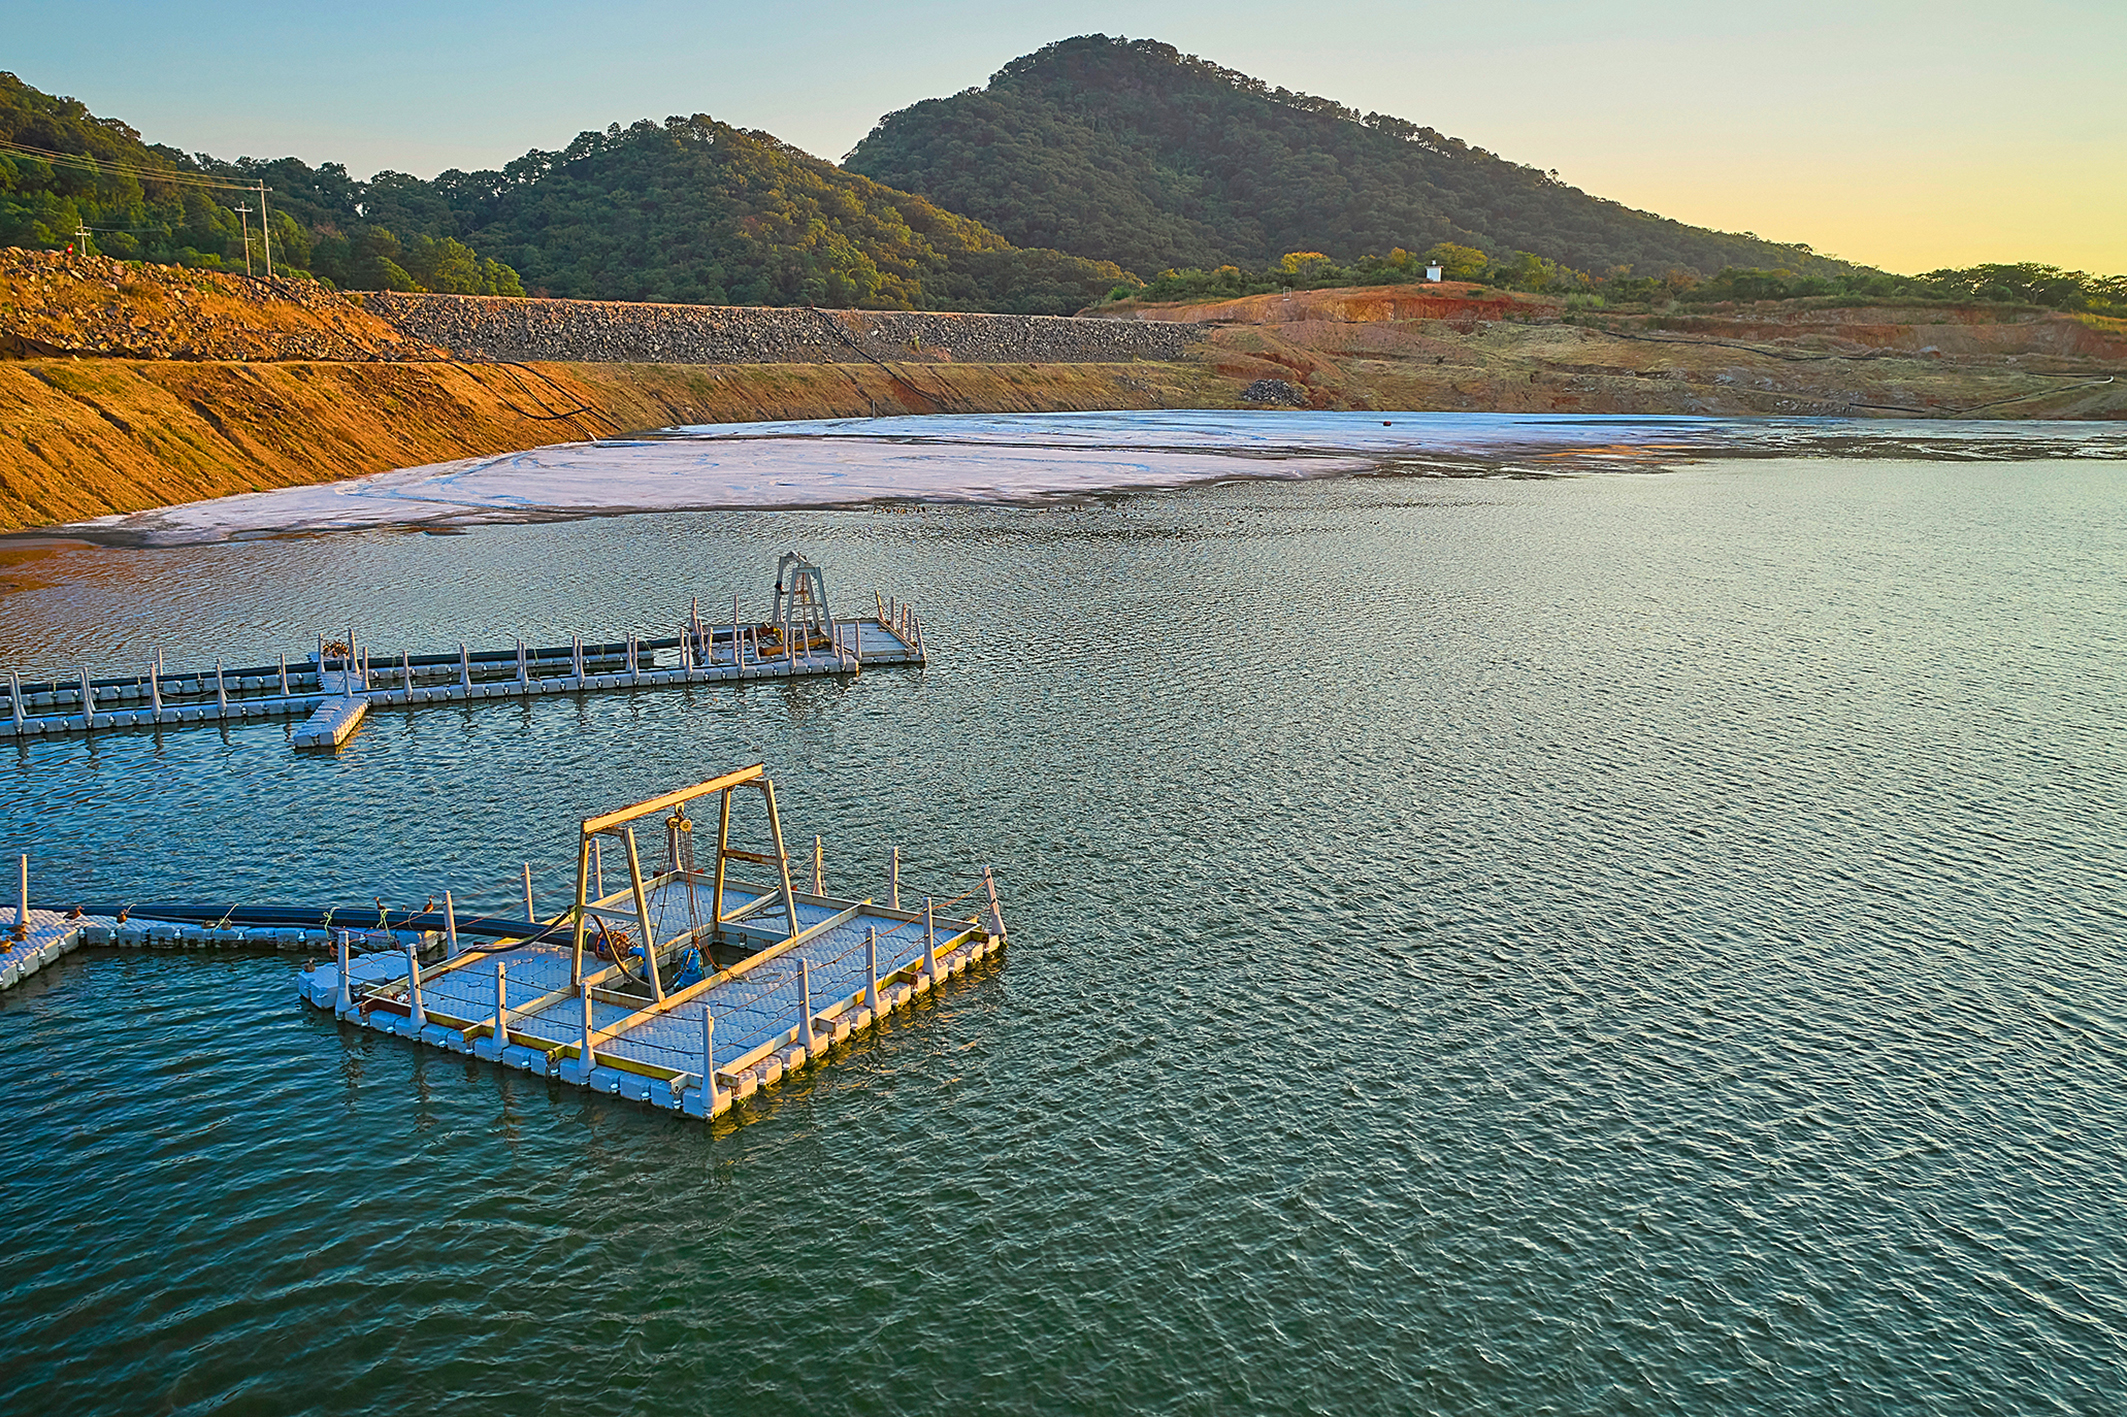
Aerial view of tailings deposit, Tizapa unit
103-1, 103-2, 103-3, 303-1
We recognize the importance of water, and we value it as a shared resource. We optimize our water use and avoid discharges by using closed circuits. In most of our facilities we conduct direct and indirect metering and strictly control consumption.
We use water primarily to process minerals, in chemical reactions, the cooling of industrial equipment, control and prevention of emissions, and for drinking and washing by our personnel.
Our operations do not significantly affect any water source. The corresponding regulations require a permit or concession from the federal or national water authorities, depending on the availability of the resource. In the case of pit water, its use also has no impact on water sources, because given the conditions and depths from which it is extracted, it is not connected directly to underground aquifers or surface runoff, which are the supply sources exploited by other users of this resource.
303-3, 303-5
In 2020, the total amount of water extracted from natural sources—springs, ground water, municipal water systems and pit water—for all our operations totaled 8.17 million cubic meters. This was complemented with 5.15 million cubic meters of municipal wastewater, purified in our treatment plants. Both types of water are used in productive processes and sanitary services. The rest of it is recirculated water from our facilities, and is equivalent to the consumption of 14.83 million cubic meters. The reduction in the amount of recirculated water compared to last year (33.8 million cubic meters) was due to the conclusion of operations at Milpillas, Madero and Bismark.
The volume of surface water, ground water, pit water, treated water or water we consume from outside sources is determined by direct metering; the volume of recirculated water is obtained by an estimate of pumping capacity and operating time.
![]() 14.83 M
14.83 M
cubic meters is recirculated water from our facilities.
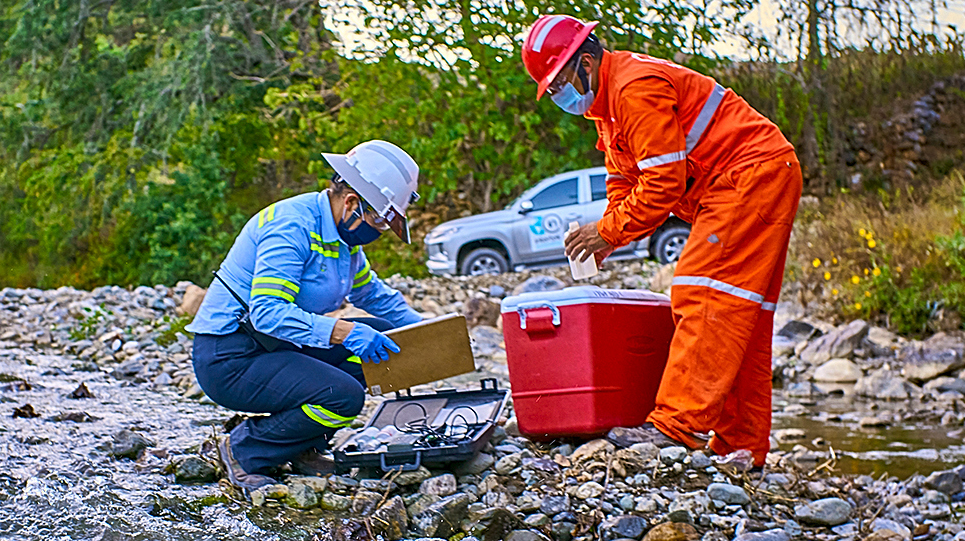
Environmental control, Capela unit
5.15 million cubic meters of municipal wastewater were purified in our treatment plants, to be used in productive processes.
| First-use water | Treated wastewater |
Internally recirculated | Water stress classification in the area | |||||||
|---|---|---|---|---|---|---|---|---|---|---|
| Facilities in water-stressed areas |
Unit |
Spring water |
Ground water |
Municipal |
Mine water |
Municipal |
Internal |
Recirculated |
Aqueduct Water Risk Atlas |
National Water |
| Tizapa | m3 |
206,811.00 |
500,974.00 |
14,175.00 |
1,478,174.38 |
Extremely high (>80) |
Extremely high |
|||
| Sabinas | m3 |
272,038.00 |
477,777.00 |
1,026,019.58 |
Extremely high (>80) |
High |
||||
| Velardeña | m3 |
440,863.00 |
1,068,920.00 |
16,663.00 |
8,190,311.36 |
High (40-80%) |
High |
|||
| Capela | m3 |
130,128.98 |
484,309.00 |
150,259.20 |
1,541,770.72 |
Low - medium (10-20) |
High |
|||
| Madero | m3 |
545,635.00 |
1,258,868.71 |
Extremely high (>80) |
High |
|||||
| Bismark | m3 |
395,718.00 |
781,367.40 |
Extremely High (>80) |
High |
|||||
| Milpillas | m3 |
168,737.00 |
42,873.80 |
22,621.81 |
Extremely High (>80) |
High |
||||
| Naica | m3 |
39,967.00 |
19,787.80 |
Extremely High (>80) |
High |
|||||
| Exploration Projects | m3 |
1,666.00 |
16,130.00 |
Extremely High (>80) |
High |
|||||
| Exploration Offices | m3 |
2,034.10 |
High (40-80) |
High |
||||||
| Bermejillo | m3 |
41,852.04 |
High (40-80) |
High |
||||||
| Fertirey | m3 |
19,938.00 |
24,166.42 |
High (40-80) |
High |
|||||
| Smelter | m3 |
135,669.00 |
1,021,455.00 |
High (40-80) |
High |
|||||
| Refinery | m3 |
119,277.00 |
119,394.00 |
High (40-80) |
High |
|||||
| Zinc | m3 |
191,412.00 |
3,435,938.00 |
High (40-80) |
High |
|||||
| Ramos Arizpe | m3 |
20,535.54 |
2,248.00 |
High (40-80) |
High |
|||||
| Dolomite | m3 |
213.00 |
High (40-80) |
High |
||||||
| Química del Rey | m3 |
3,415,569.27 |
310,108.00 |
High (40-80) |
High |
|||||
| Industrias Magnelec | m3 |
2,252.00 |
High (40-80) |
High |
||||||
| Salinas del Rey | m3 |
1,200.00 |
High (40-80) |
High |
||||||
| Química Magna | m3 |
448.00 |
High (40-80) |
High |
||||||
| Subtotal by type | m3 |
206,811.00 |
4,364618.83 |
470,444.10 |
3,132,352.80 |
5,146,588.42 |
1,795,195.71 |
13,040,265.25 |
||
| Subtotal | m3 |
0.7% |
15.5% |
1.7% |
11.1% |
18.3% |
6.4% |
46.3% |
||
% |
17.9% |
11.1% |
18.3% |
52.7% |
||||||
| % | 100% |
|||||||||
Out of the total water required to make our products:
52.7% is water recirculated within our facilities, optimizing its use.
18.3% is wastewater treated in our own or outside facilities, to reduce our consumption of primary-use water.
29% is primary-use water.
Source for classifying water stress: WRI Aqueduct Water Risk Atlas.
WATER USE BY SOURCE (%)
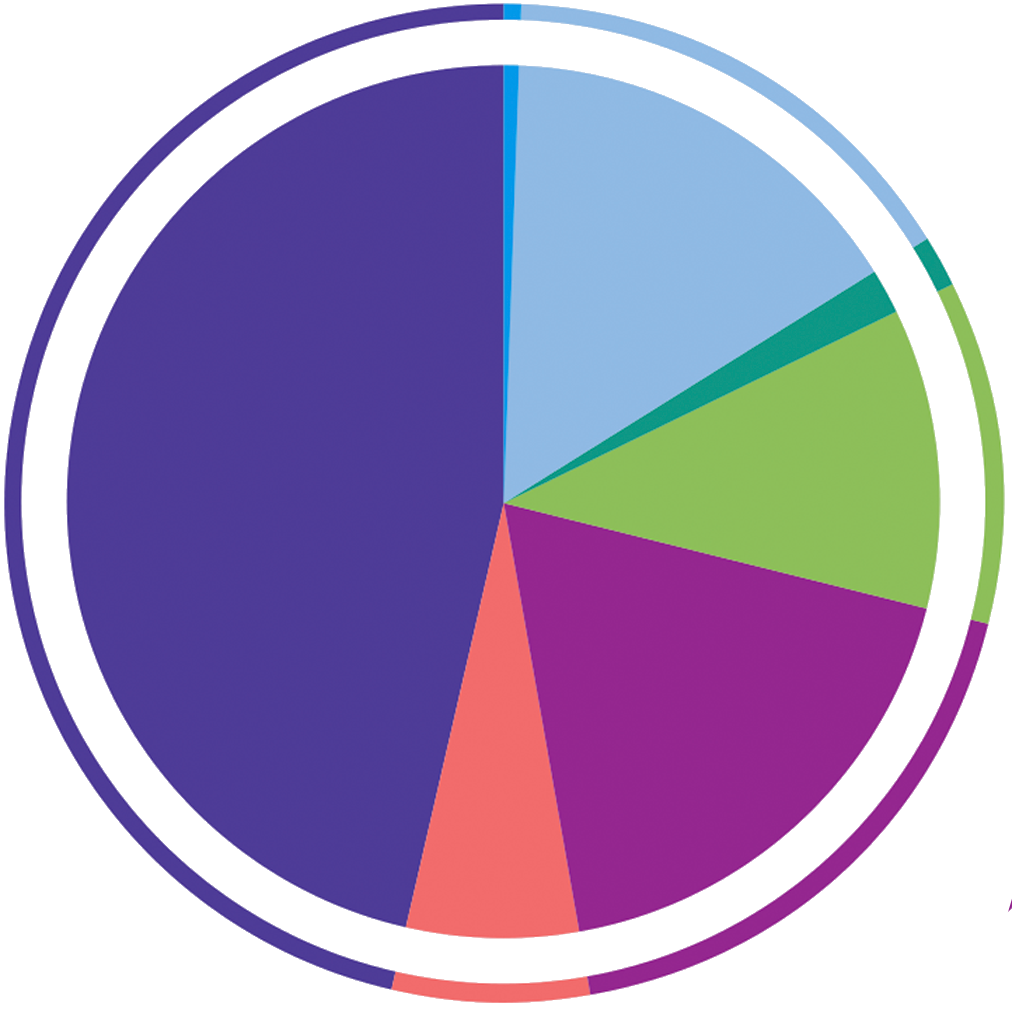
0.7
15.5
1.7
11.1
18.3
6.4
46.3
| Spring water |
| Ground water (well) |
| Municipal |
| Mine water |
| Municipal wastewater |
| Internal sanitary services network |
| Recirculated |
PRIMARY WATER USE ECO-EFFICIENCY INDEX
(m3/t of production)
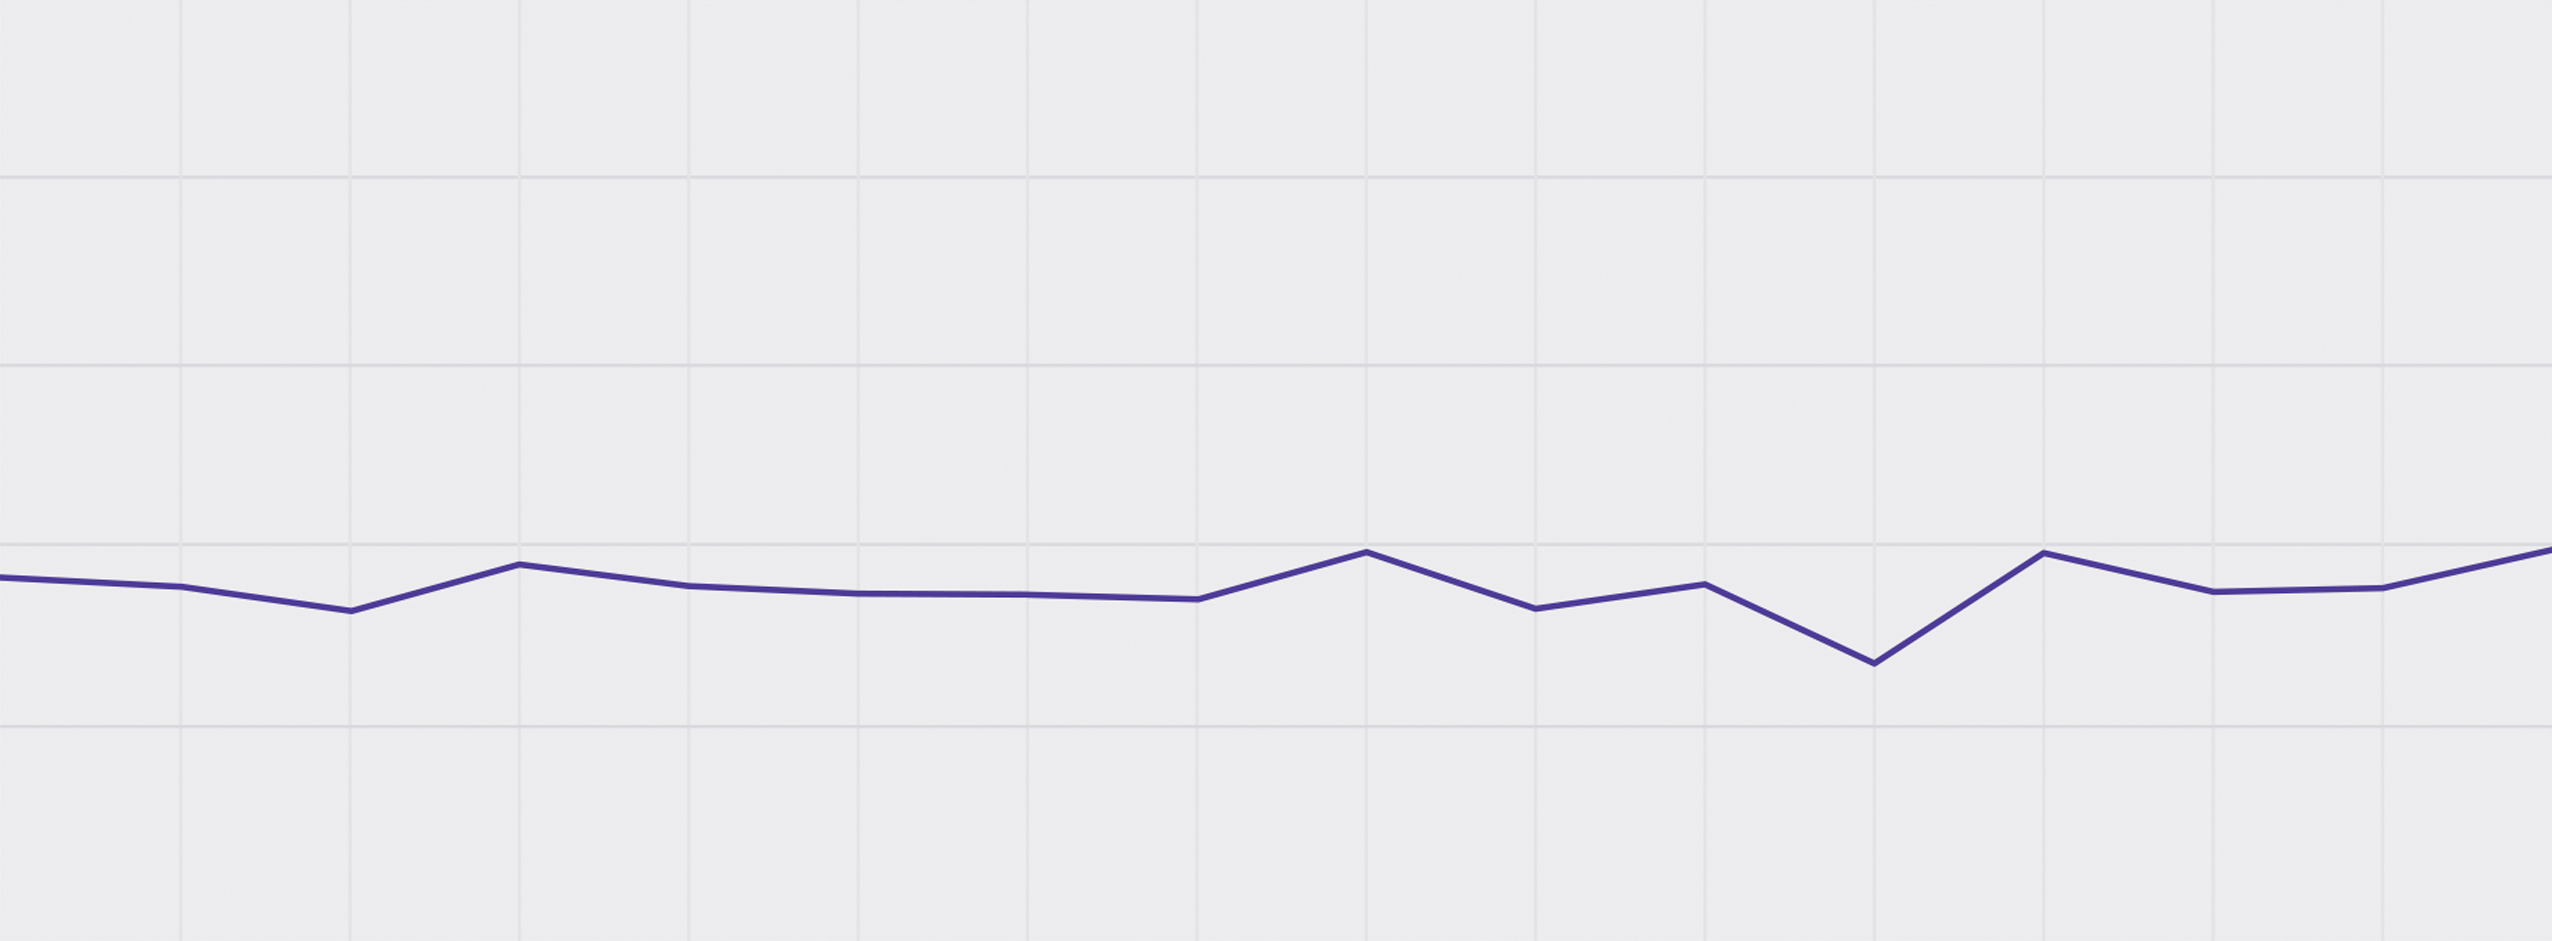
2.0
1.6
1.2
0.8
0.4
0
2005
2006
2007
2008
2009
2010
2011
2012
2013
2014
2015
2016
2017
2018
2019
2020
Cabe mencionar que 3.13 millones de metros cúbicos de agua de primer uso corresponden a agua de laboreo de mina la cual, por la profundidad y las condiciones en que se encuentra, no se considera accesible, a menos que se extraiga en las operaciones mineras. No obstante, el índice de ecoeficiencia (m3 agua/t de producto) sí considera el agua de laboreo de mina y los productos finales de todas nuestras operaciones, salvo en el caso de minas donde se utilizan las toneladas del mineral molido.
El ligero incremento en el índice se debió principalmente a la caída en la producción en las minas Madero, Bismark y Milpillas.Durante 2020, la huella hídrica azul directa de nuestros productos —sin considerar el agua por los insumos— fue de 3.43 l/kg para nuestros productos metálicos y 3.84 l/kg en el caso de los productos químicos.
| 2005 | 2006 | 2007 | 2008 | 2009 | 2010 | 2011 | 2012 | 2013 | 2014 | 2015 | 2016 | 2017 | 2018 | 2019 | 2020 | |
|---|---|---|---|---|---|---|---|---|---|---|---|---|---|---|---|---|
| Metals | 0.2329 |
0.2299 |
0.2211 |
0.2290 |
0.2506 |
0.2493 |
0.3821 |
0.3433 |
0.3277 |
0.2774 |
0.2601 |
0.2933 |
0.2804 |
0.3762 |
0.2800 |
0.3326 |
| Chemicals | 1.9458 |
2.1018 |
1.5565 |
2.2714 |
2.3585 |
2.3822 |
2.3307 |
2.4191 |
2.9101 |
3.0632 |
3.2134 |
2.5513 |
2.9337 |
2.8562 |
3.1100 |
3.0267 |
| Mines | 0.5423 |
0.4867 |
0.5239 |
0.4740 |
0.4333 |
0.4007 |
0.4240 |
0.4485 |
0.5760 |
0.4283 |
0.4562 |
0.3282 |
0.5788 |
0.5206 |
0.4000 |
0.5511 |
| PEÑOLES | 0.7220 |
0.7021 |
0.6498 |
0.751 |
0.7039 |
0.6871 |
0.6852 |
0.6750 |
0.7866 |
0.6545 |
0.7074 |
0.5375 |
0.7798 |
0.6910 |
0.6991 |
0.7922 |
BLUE WATER FOOTPRINT*
3.43 l/kg
metal products
3.84 l/kg
chemical products
* Calculated based on the rules of the methodology for determining the volume of efficient use of nation-al waters referred to in the Action Program provided in article six, transitory of the Decree to Reform, Add and Repeal Various Provisions of the Federal Water Law, published November 18, 2015 in the Official Ga-zette of the Federation, 22/02/2016.
303-2, 303-4, 306-5, EM-MM-140a.2
Our business units do not discharge industrial wastewater into water bodies. Only in certain cases do they discharge water from sanitary services, whose quality is within the limits established by applicable regulations. Systems for treating and reusing municipal wastewater enable us to take advantage of this resource while avoiding environmental pollution. In 2020, the total volume of water from municipal waste, sanitary services and recirculation was 20 million cubic meters.
In this 2020 Report we present the sustainability performance of the operations of Peñoles and the generation of shared value with the groups of interest.